Trading Update: Monday May 23, 2022
Emini pre-open market analysis
Emini daily chart
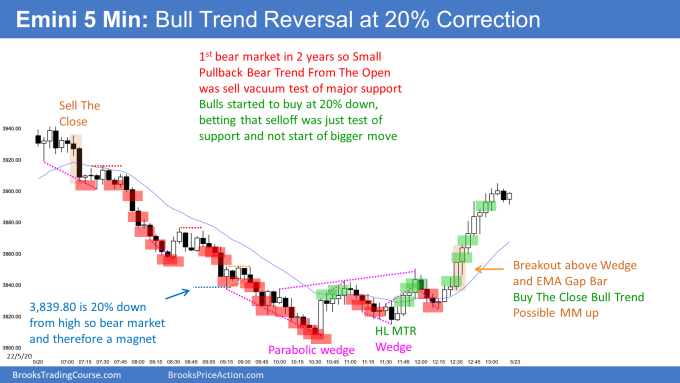
- Emini likely to rally this week after market reached a 20% correction (3,839.8) on Friday.
- The market reached a 19% correction on May 12, however the odds were any bounce would be minor, and the market would have to fall below the 20% correction level (which it did last Friday).
- There will be value investors looking to add to long-term investments at this level. These value investors are always happy to buy at 10%, 20%, 30%, or 40%. They will see the market at a discount and be comfortable holding for years.
- At the moment, the daily chart of the Emini looks like it will have to bounce for a couple of legs. The channel down from April 25 looks like a bear leg in a trading range, which means traders should soon expect a bull leg in a trading range.
- One thing Al and Andrew pointed out is that the weekly chart has seven consecutive bear bars, which is not common. This means that eight consecutive bear bars are uncommon, which increases the probability of the Emini having a close above the open of the week. This means the daily chart may rally over the next five trading days.
Emini 5-minute chart and what to expect today
- Emini is up 36 points in the overnight Globex session.
- The market has been in a broad trading range for the Globex session.
- Today will likely go above Friday’s high. The market may gap above yesterday’s high, which would satisfy going above it.
- The bulls have a reasonable shot at getting a close above today’s open. They hope that today will be an strong trend day; the bears will want the opposite.
- Since today will gap up on the open, the market may have to go sideways on the open and test the moving average.
- As always, traders should consider waiting for 6-12 bars if they have trouble trading the open.
- Lastly, traders should also consider waiting for a credible stop entry or a strong breakout with follow-through. A reasonable stop entry could be a double bottom/top or a wedge bottom/top.
- Also, it is essential to remember that 50% of the time, the initial move will completely reverse (May 19 was a good example).
Friday’s Emini setups

Al created the SP500 Emini charts.
Here are several reasonable stop entry setups from Friday. I show each buy entry with a green rectangle and each sell entry with a red rectangle. Buyers of both the Brooks Trading Course and Encyclopedia of Chart Patterns have access to a much more detailed explanation of the swing trades for each day (see Online Course/BTC Daily Setups).
My goal with these charts is to present an Always In perspective. If a trader was trying to be Always In or nearly Always In a position all day, and he was not currently in the market, these entries would be logical times for him to enter. These therefore are swing entries.
It is important to understand that most swing setups do not lead to swing trades. As soon as traders are disappointed, many exit. Those who exit prefer to get out with a small profit (scalp), but often have to exit with a small loss.
If the risk is too big for your account, you should wait for trades with less risk or trade an alternative market like the Micro Emini.
EURUSD Forex market trading strategies
EURUSD Forex daily chart

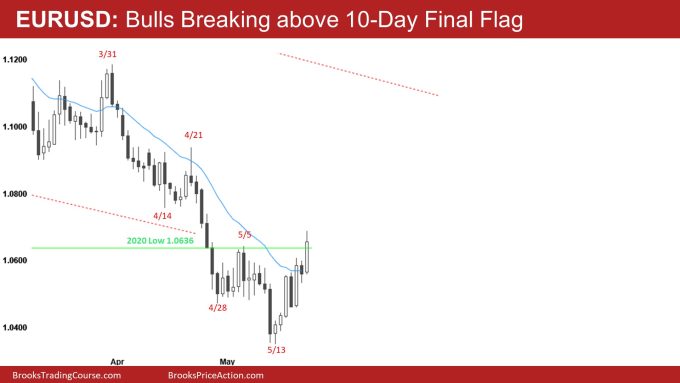
- The EURUSD broke above the May 5 top of the ten-day final flag this morning.
- The bulls want this to be an early stage of a strong rally that tests back into the March – April trading range.
- The bulls also want the market to test the April 21 high, which is the top of a sell climax.
- The market broke above a double top (May 5 and May 19, so the market may get a measured move projection to 1.0865, which would drive the market up to the bottom of the March – April trading range.
- The bears hope the breakout above the May 5 high leads to a failed breakout of a lower high in a broad bear channel that continues down.
- Bears may see the April 21 high as a major lower high, and as long as the market stays below it, the bears will conclude that market is still in a bear trend.
- More likely, the market is forming a bottom and will ultimately rally higher.
- The market is also back at the 2020 low (green line on chart).
- Today, the bulls have broken out above the 20-period moving average and the May 5 high and want today to close on its high and tomorrow to be a follow-through bar that would convince traders that the market is breaking out to the upside.
- Bears want the opposite and hope that today or tomorrow is a big bear bar closing on its low similar to May 18. Even if the bears get a big bear close, the bulls still have a 6-bar bull micro channel which increases the odds of a second leg up after any pullback.
Summary of today’s S&P Emini futures price action and what to expect tomorrow
- Al will post chart after the close.

Al created the SP500 Emini charts.
End of day summary
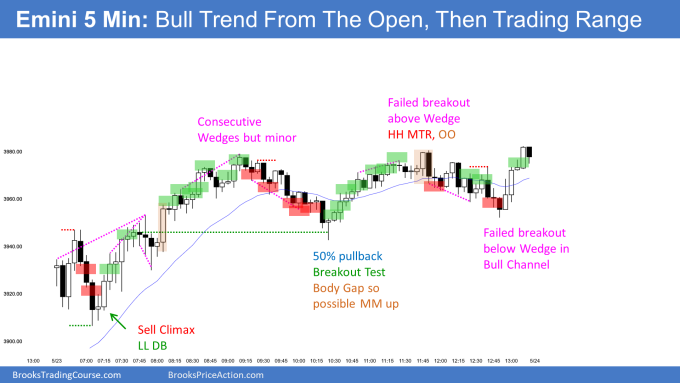
- Today was a bull trend from the open that evolved into a trading range day.
- The market formed consecutive wedge tops around 9:15 PT and went sideways for the rest of the day.
- The bears tried to reverse the market around 7:00 PT. However, it was a failed breakout of the bar 3 low and created a double bottom. The odds favored at least a second leg down after the three consecutive bear bars at 7:0 Per the bears got trapped, and the market rallied to a new high.
- The rally up to 7:45 PT was strong enough that the first reversal down was likely to fail and lead to sideways to up.
- The bulls got a surprise breakout bar above the wedge top at 7:45 which led to another wedge top around 9:15 PT (consecutive wedge tops).
- Although the market was in a small pullback bull trend at 9:15, the rally looked weak, which increased the probability of a deeper pullback, which happened at 10:30 PT. Note, the selloff at 10:30 also tested 7:30 PT outside up bull bar which is arguably the when the market became always in long.
- The market tested the 9:15 high around 11:45 and continued to go sideways into the close.
- Overall, when the market has a trend from the open, there is a 60% chance the market will evolve into a trading range and only a 20% chance of a continued bull trend all day. Also, there is a 20% of a bull trend from the open reversing into a bear trend.
- Today was a good day for the bulls and increased the odds of more sideways to up on the daily chart. Also, the weekly chart will likely close above its open. One can read the weekend blog for further details.
See the weekly update for a discussion of the price action on the weekly chart and for what to expect going into next week.
Trading Room
Traders can see the end of the day bar-by-bar price action report by signing up for free at BrooksPriceAction.com. Al talks about the detailed S&P Emini futures price action real-time throughout the day in the BrooksPriceAction.com on trading room days. We offer a 2 day free trial.
Charts use Pacific Time
When times are mentioned, it is USA Pacific Time. The Emini day session charts begin at 6:30 am PT and end at 1:15 pm PT which is 15 minutes after the NYSE closes. You can read background information on the market reports on the Market Update page.


Hello, I noticed that the H2 wasn’t marked as a creditable buy at bar 38. Yet a similar setup (sell) on May 18 L2 sell on bar 43 was valid.
Could you explain the difference in context.
Thanks
Hi James,
Your question is certainly reasonable to ask. Let’s start with the May 18 L2 at bar 43. This was a two-legged pullback after a wedge bottom (25, 32, & 36). May 18 was a strong trend from the open bear trend. However, the channel down was very tight, and the bears had the strong bear breakout bars 19 – 24 and had a reasonable chance at a measured move down. Also, bar 36 (9:30 PT) was likely a minor reversal, which means that the best the bulls could expect was a minor reversal up to the moving average.
While May 23 was a trend from the open, there are some differences. May 23 went sideways for the first 12 bars. Also, May 23 did not have a strong breakout as the bears got on May 18 during bars (19-24). So overall, the May 23 trend from the open was not as strong as the May 18 bear trend, which increased the odds of May 23 evolving into a trading range.
Lastly, If you have the Encyclopedia of Chart Patterns at Al Created (comment if you do not know what I am talking about), look at Part 8, Slide 166. This slide shows that 60% of the trend from the open bull trend evolves into a trading range at some point during the day, and only 20% of the bull trend from the open continues as a bull trend for the rest of the day. The same probabilities are applied to a bull trend from the open. This means that May 18 was one of those 20% times that a trend from eh open remains a trend all day.