Trading Update: Thursday January 5, 2023
Emini pre-open market analysis
Emini daily chart

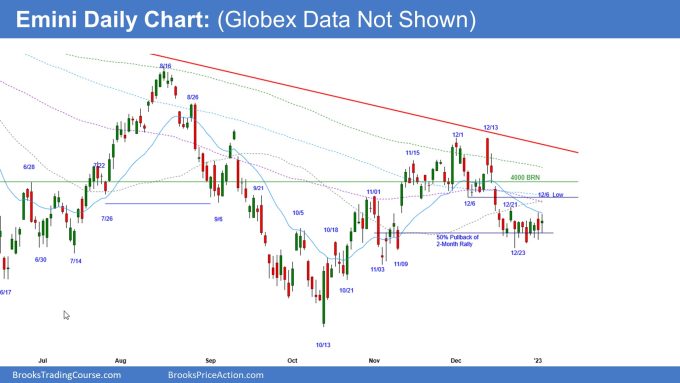
- Emini in tight trading range on daily chart, and in middle of a 12-day tight range, which is breakout mode.
- The probability of a breakout up or down is close to 50%. While the probabilities may slightly favor the bulls, the market would not be in a tight trading range if one side had a clear advantage.
- The bulls want the 12-day tight trading range to form a higher low and rally back into the December month-long trading range.
- If the bulls are lucky, they will get an upside breakout in the form of consecutive strong bull breakouts during the test of the December 13th close. This would increase the odds of the bulls getting a breakout above the December 13th high and testing the August high.
- More likely, the bulls will be disappointed by any rally, just like the bears have been disappointed with the follow-through after the five consecutive bear-bar breakout two weeks ago.
- At a minimum, the bulls want to test the December 6th low, the bottom of the month-long trading range. Bulls got trapped buying the December 6th low during the December 15th bear breakout. Some of those bulls scaled in lower and got out breakeven on December 21st; however, others would hold long for a test back into the month-long trading range low.
- The bears see the 12-day tight trading range as a pullback from the December 20th five-bar bear breakout. They want a second leg down testing the November low and possibly the October low.
- If the bears will reach the October low, they need a strong downside breakout below the 12-day tight trading range. They need consecutive solid trend bars with small tails and big bodies. Otherwise, traders will see the second leg down from here as a second leg trap and look to buy, betting on continued trading range price action.
- Overall, the market is in a trading range on the daily chart. It is forming a tight trading range close to the midpoint of the past six months. This is neutral price action, meaning most traders should wait for the breakout before trading.
Emini 5-minute chart and what to expect today
- Emini is down 20 points in the overnight Globex session.
- The Globex market has been in a trading range for most of the overnight and early morning session.
- The bears got a downside breakout at 5:30 AM PT, and they hope this is the start of a strong trend day.
- More likely, the current selloff will disappoint the bears and remind traders that the market is in a trading range.
- Traders should assume that today will have a lot of trading range price action and continue disappointing swing traders.
- Traders should assume the first 6-12 bars on the open will go sideways and consider not trading them unless they are comfortable with limit orders.
- Traders can also wait for a strong breakout with follow-through; however, at that point, the risk would be bigger, so they would need to trade the appropriate position size.
- The market often forms a swing trade after it forms a double top/bottom or a wedge top/bottom. These are four very common patterns during the opening session, which means a trader can wait for one of these patterns to form before trading a stop-entry trade.
- The single most important thing on the open is to be patient. If the bars are overlapping, wait for a clear breakout with follow-through.
- If the day is going to become a strong trend day, there will be plenty of time to trade in the direction of the trend, so there is no risk in waiting.
Emini intraday market update
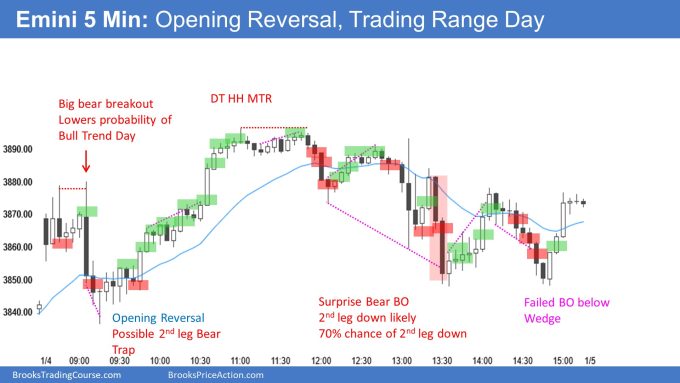
- The Emini sold off in a 4-bar bear microchannel on the open. This was a strong enough surprise to likely have a second leg down, even though the market went above the high of bar 1 around 7:10 AM PT.
- The rally up to 7:10 AM PT damaged the bear case, though, which means sideways is most likely. This is a big down, big up, big confusion, so sideways is most likely.
- I am tying this at 7:35 AM PT, and the bears are likely getting the second leg down right now. However, it will probably stall around the low of bar 4 if it reaches it.
- The bulls will likely get a second leg up from the 7:10 AM rally, even if the second leg is just a retest of the 7:10 high.
- Overall, this is a trading range open. Eventually, there will be a breakout up or down; however, traders should be patient.
- Traders should be open to a double bottom, with the 7:30 AM area being the second leg and bar 4 being the first. If the bulls can get a double bottom, they will try and break out above the neckline (bar 1) and get a measured move up.
- At the moment, I think an upside breakout is more likely than a downside breakout. This is because the bears have been selling off since yesterday’s bar 40. This means the market will probably convert into a trading range and go sideways to up.
Yesterday’s Emini setups

Brad created the SP500 Emini charts.
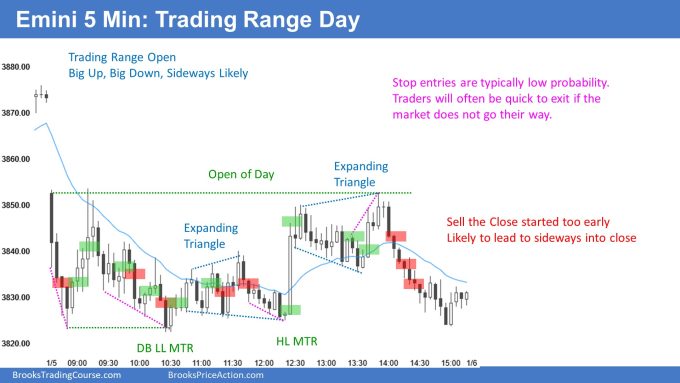
Here are several reasonable stop entry setups from yesterday. I show each buy entry with a green rectangle and each sell entry with a red rectangle. Buyers of both the Brooks Trading Course and Encyclopedia of Chart Patterns have access to a much more detailed explanation of the swing trades for each day (see Online Course/BTC Daily Setups).
My goal with these charts is to present an Always In perspective. If a trader was trying to be Always In or nearly Always In a position all day, and he was not currently in the market, these entries would be logical times for him to enter. These therefore are swing entries.
It is important to understand that most swing setups do not lead to swing trades. As soon as traders are disappointed, many exit. Those who exit prefer to get out with a small profit (scalp), but often have to exit with a small loss.
If the risk is too big for your account, you should wait for trades with less risk or trade an alternative market like the Micro Emini.
EURUSD Forex market trading strategies
EURUSD Forex daily chart

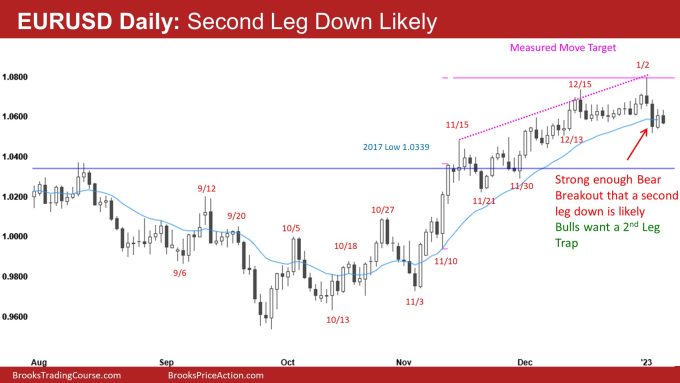
- The market formed a wedge top after reaching the measured move target (purple line) and reversed down, reaching the moving average.
- The breakout on January 3rd was enough of a surprise that the market will likely have a second leg down.
- The bulls hope that the January 3rd bear breakout is a second-leg trap that traps traders into a bad short at support (moving average). Next, they want the market to reverse up to a new high.
- More likely, the bear breakout on January 3rd will have a second leg down. This means there are probably more sellers above yesterday’s bull bar than buyers.
- Traders will pay close attention to see what happens back at the January 3rd close. If bears buy back shorts on a test of the January 3rd close, that would be a sign of weakness and increase the odds of going sideways. If bears sell more on a test of the January 3rd close, it will increase the odds of lower prices.
- Overall, the daily bull channel that began on November 21st is likely evolving into a trading range, which means that bears will probably get a couple of legs down.
Summary of today’s S&P Emini futures price action and what to expect tomorrow

Brad created the SP500 Emini charts.
End of day review
- I will update at the end of the day.
See the weekly update for a discussion of the price action on the weekly chart and for what to expect going into next week.
Trading Room
Al Brooks and other presenters talk about the detailed Emini price action real-time each day in the BrooksPriceAction.com trading room. We offer a 2 day free trial.
Charts use Pacific Time
When times are mentioned, it is USA Pacific Time. The Emini day session charts begin at 6:30 am PT and end at 1:15 pm PT which is 15 minutes after the NYSE closes. You can read background information on the market reports on the Market Update page.


Hi Brad,
Concerning your 1/4/23 Emini chart:
1) You’ve got a sell (the close?) marked for bar 14. This doesn’t seem warranted given that the market has strong support as seen by the tails below the 6 prior bars. Also, if you took the buy above 12 as marked, you just got whipsawed. Would someone really trade this way bar by bar? It seems like the bigger picture is that the market is trying to reverse to the upside given the poor follow-through of bars 7 and 8.
2) Bar 38 or 39 (not clear) is marked as a buy but why would you recommend buying above doji bars in a trading range?
3) Under bar 47 there are several extra buy markings that do not seem to corollate with any particular bar. Are those typos?
4) Bar 56 (follows news bar) is marked a sell. As the news bar is a large bear doji (essentially a one bar trading range), why attempt to sell out of range here?
Thank you for your comments!
Hi, Silly Putty!
I don’t know if my answers will be satisfactory, but maybe they can help you.
1) The sell below bar 14 is a stop sell, believing a market that has made a breakout (bar 7-8) and formed an L2 shaped correction and maybe a fail to bulls who buy above 12. A buy above bar 12 is also a stop entry believing the breakout to fail, and theoretically a second entry into the buy, as well as having bears ambush for those who sold below bar 8 and failed to exit at breakeven at bar 11. Finally, I believe that no one trades on all these entries. The entry stop loss above bar 12 would be a low below bar 12 and best placed below bar 9, which was never touched. And the stop loss on the short below bar 14 would be above bar 7. Since bulls got a strong breakout at bar 15-16 and leaving sellers trap at bar 15, the sellers would probably get out at that point and not let their stops get hit.
2) At that point the market would not yet be in a trading range, as far as I know Al Brooks uses the name trading range after 20 or more bars as this is when the market becomes almost neutral (50% chance of breaking up and 50% chance of breaking down). There the market can be understood as a pullback and likely to be an H2 after a breakout, in this case ten bar two legs (TBTL) sideways.
3) Yes, I believe it’s a typo, since the marked entries are thinking in stop order.
4) Because the market formed an iOi pattern (inside-outside-inside), the pattern was composed of 3 bearish bars, the last one closing close to the low, this increases the probability of a successful operation a little more. Market was also in a bear trend since bar 40.
Great. Thank you Filipe, I will take another look at the chart this weekend.
2) I believe Bar 37 is the marked buy, not 38 or 39. (H2, good signal bar).
That is correct. A trader buying above bar 38 is taking a low probability buy betting on a micro double bottom.
They want a quick upside breakout, and once they see bar 39 close as a doji, most bulls would be very quick to exit the trade around break even.
Generally, when a trader takes a low probability stop entry to buy, such as bar 37, they want the follow-through to be quick. The reason for this is that their premise may no longer be valid. They are buying above 37, hoping for fast momentum up, and when 38 closes as a doji, the stop entry bulls are wrong.
You can argue the same logic below in bar 14. If one took the sell, they know it is a low probability short. Most traders would exit above the bar 14 high due to the risk of a bull breakout of a bear flag and two legs up. Some bears who took the sell below bar 14 would be very quick to exit, especially since the market triggered the 14 sell and immediately went up.