Trading Update: Thursday May 9, 2024
End of day video review
S&P Emini pre-open market analysis
Emini daily chart
- The Emini formed a High1 buy signal bar. High 1 setups typically lead to pullback and trend resumption. This means there might be sellers above yesterday’s high, leading to a brief pullback lasting 1 – 2 bars.
- Just because there might be more sellers above yesterday’s high, does not make it a great short. The bar is closing on its high and High 1 signal bars, such as this one, often get trend resumption after a pullback. This means traders should look for the trend resumption, not a sell above the bar.
- The problem with the bulls is that yesterday was a High 1 buy signal with leg 2 of an overall trading range. This increases the risk of a deep pullback and possible 2nd leg trap.
- The odds slightly favor the bulls, and price testing is close to 5,300, which is a magnet based on the bull breakout of the double bottom (April 19th low to the April 29th high).
- The bears do not mind a rally up to 5,300 as long as they can form a major trend reversal and break below the April low. The next target for the bears would be the low of the year (January 5th), which is also the bottom of the bull channel on the daily chart.
- Overall, traders will pay attention to what kind of entry bar the bulls can get following yesterday’s high 1 buy signal bar. The bulls want a strong entry bar closing on its high, trapping the bulls out of a winning long position and the bears into a losing position.
Emini 5-minute chart and what to expect today
- The Emini formed a bull breakout on the 15-minute chart during the 8:30 AM EST report bar. However, the follow-through bar is a bear doji bar, which is disappointing for the bulls.
- The bears are hopeful that the 8:30 AM EST bull breakout will fail and lead to a reversal down.
- Traders should pay attention to yesterday’s High as it is a magnet. The bull want to trigger the buy above yesterday’s high and break far above it.
- The bears want to prevent yesterday’s high 1 from getting a strong entry bar.
- As always, traders should assume that today will have a lot of trading range price action until proven otherwise.
Yesterday’s Emini setups

Al created the SP500 Emini charts.
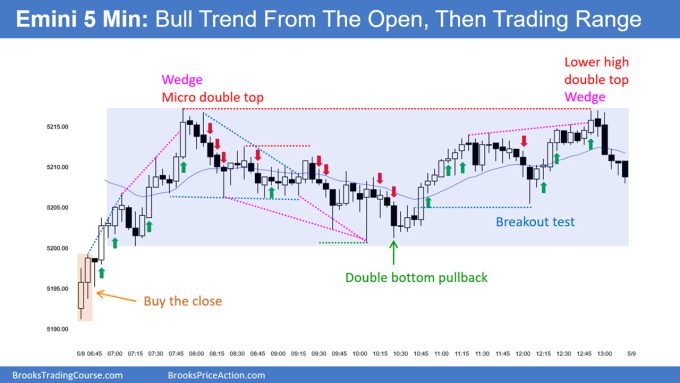
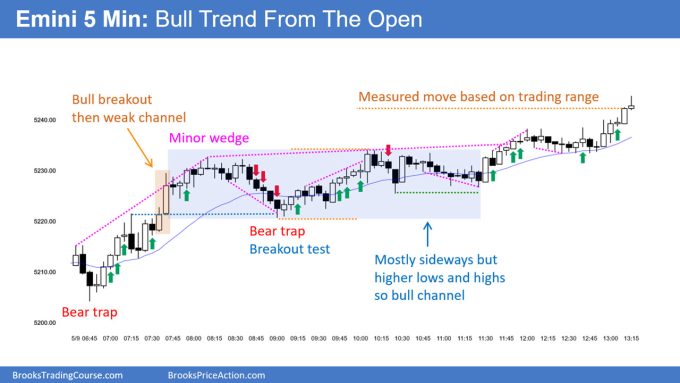
Here are reasonable stop entry setups from yesterday. I show each buy entry bar with a green arrow and each sell entry bar with a red arrow. Buyers of both the Brooks Trading Course and Encyclopedia of Chart Patterns have access to a near 4-year library of more detailed explanations of swing trade setups (see Online Course/BTC Daily Setups). Encyclopedia members get current daily charts added to Encyclopedia.
My goal with these charts is to present an Always In perspective. If a trader was trying to be Always In or nearly Always In a position all day, and he was not currently in the market, these entries would be logical times for him to enter. These therefore are swing entries.
It is important to understand that most swing setups do not lead to swing trades. As soon as traders are disappointed, many exit. Those who exit prefer to get out with a small profit (scalp), but often have to exit with a small loss.
If the risk is too big for your account, you should wait for trades with less risk or trade an alternative market like the Micro Emini.
Summary of today’s S&P Emini price action

Al created the SP500 Emini charts.
See the weekly update for a discussion of the price action on the weekly chart and for what to expect going into next week.
Trading Room
Al Brooks and other presenters talk about the detailed Emini price action real-time each day in the BrooksPriceAction.com trading room days. We offer a 2 day free trial.
Charts use Pacific Time
When times are mentioned, it is USA Pacific Time. The Emini day session charts begin at 6:30 am PT and end at 1:15 pm PT which is 15 minutes after the NYSE closes. You can read background information on the market reports on the Market Update page.


Why wasn’t 12 a buy? Bull BO above wedge top, closed above 7 high, expect second leg up from 1-7. I guess wedge climax and you’re in a 3rd leg counting from 3 implied pullback?
Hi Garrett,
Ref yesterday’s chart that buy did not trigger until Bar 15 with the 2 bear bars following below Bar 12’s high.
Feasible to show an entry on Bar 15, yes, but most traders would likely cancel order and wait for clarity (with possible minor reversal at least). That clarity came on Bar 15 so the entry on Bar 16 lost only 1 tick for late entry.