Market Overview: S&P 500 Emini futures
The S&P 500 Emini futures pause after testing the February 2 high this week on the weekly chart pulling back slightly to close below it. The bulls hope that this is simply a pause before the trend resumes higher to test the January high. The bears want the Emini to stall around February 2 high and reverse lower from a double top bear flag.
S&P 500 Emini futures
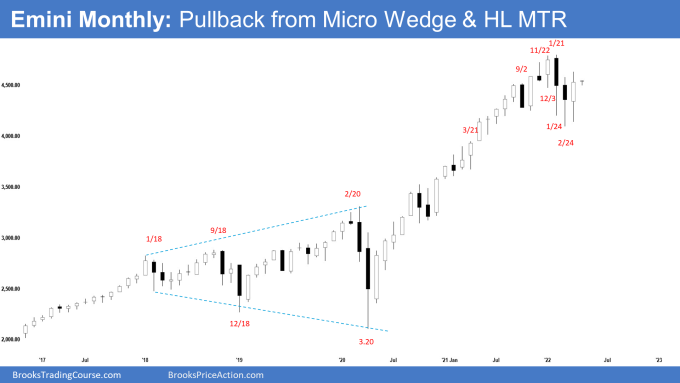
The Monthly S&P Emini chart

- The March monthly Emini candlestick was a bull bar with a long tail above and below, closing in the upper half of the range.
- We have said that in February a weak sell signal bar and selling below a weak sell signal bar at the bottom of a developing 8-month trading range is not an ideal sell setup. Odds are there will be buyers below. The bulls see the January – February selloff as a long-overdue pullback. They want a reversal higher from a micro wedge bull flag (December 3, January 24, February 24) or a double bottom bull flag with the May 2021 or June 2021 low and a retest of the trend extreme followed by a subsequent breakout to a new high.
- Al has said that due to the back-to-back OO, traders should expect a break below the January low before a break above the January high and the selloff would probably last 2 to 3 months. The sell-off lasted for 2 months plus.
- Al also said that there is a 50% chance that the February 24 low will be the low of the year and March and April form a pair of consecutive months that is the most bullish of the year, and therefore the Emini is entering a timeframe that has an upward bias. This remains true.
- While March closed as a bull bar and traded above February triggering the high 1 buy entry, it closed below February high and has a prominent tail above. It is not a very strong bull signal bar.
- Bulls want this to be the start of the re-test of the trend extreme followed by a breakout to a new high. The bulls will need to close April as another follow-through bar to increase the odds of testing the January high.
- Bears hope this is simply a pullback from the 2-months correction and want a reversal lower from a lower high or a double top with January high. The bears want a break below the February low followed by a measured move down to around 3600 based on the height of the 7-month trading range. However, since March has a good size bull body and a long tail below, it is a weak sell signal bar for a strong reversal down.
- The Emini has been in a trading range for 8 months. Odds are that the trading range will continue rather than a strong breakout from either direction.
- The bull trend on the monthly chart has been very strong. Even if it sells off for a 10 to 20% correction, that would still only be a pullback on the monthly chart (even though it could be a bear trend on the daily chart) and not continue straight down into a bear trend.
- The best the bears will probably get on the monthly chart is a trading range for many months to around a 20% correction down to the gap on the monthly chart below April 2021 low and around the 4,000 Big Round Number.
- For now, odds slightly favor sideways to up for a few weeks more.
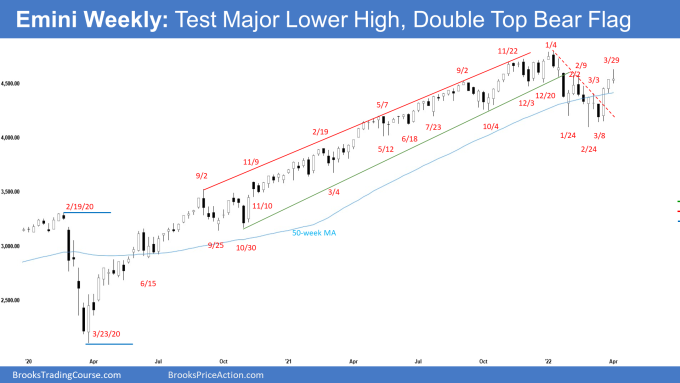
The Weekly S&P 500 Emini chart

- This week’s Emini weekly candlestick was a bull doji with a long tail above
- Last week, we said that since there was a strong bull follow-through bar closing near its high, odds slightly favor sideways to up. Since the February 2 high is less than 50 points above Friday’s close, we may even reach it early in the week.
- If next week trades higher but reverses and closes as a bear bar near the low, traders will start wondering if this will lead to a reversal from a double top bear flag.
- Bears want the Emini to stall around February 2 high and reverse lower from a double top bear flag. They want next week to have a bear body, even though the Emini may trade higher first.
- This week traded above February 2 high early in the week but closed below it. While it did not close as a bear bar near the low, it was not a strong close for the bulls.
- Bulls hope that this move up is the start of the reversal to re-test the trend extreme followed by a new high. They want consecutive bull bars closing near their highs, like the one from October 4 low. There is a 4-bar bull micro channel currently.
- The bulls hope that this week was simply a pause before the trend resumes higher, even if there is a small pullback first in the next 1-2 weeks.
- The bears hope that this leg up is simply a pullback (bounce) from the 2-month correction. They want the Emini to stall around February 2 high and reverse lower from a double top bear flag. They want next week to be a big bear bar closing near the low. If they get that, the odds of a reversal lower from a double top bear flag (February 2 and March 29) increase.
- The bears want a strong break below the February 24 low which is the neckline of the double top bear flag and a measured move down towards 3600 based on the high of the 8-month trading range.
- Al said that if the bears get the breakout below February 24 low (only a 30% chance currently), it will follow 3 strong reversals up (wedge bull flag). There would be a lot of trapped bulls because everyone expected higher prices. It would likely lead to a 50% chance of a fast sell-off for about a 500-point measured move down to 3600 based on the height of the 7-month trading range. This remains true.
- So, which is more likely? A pullback and a continuation higher or a double top bear flag and a reversal lower?
- The Emini is currently trading around the middle of the 8-month trading range. Lack of clarity is the hallmark of a trading range. Odds are, the current move up is a bull leg within a trading range, and sellers will return when the Emini moves towards the January high.
- Since this week was a bull doji and it followed 2 strong bull bars closing near their highs, it is not a strong sell setup for next week. The bears will need at least a micro double top or a strong sell signal bar before they would be willing to sell aggressively.
- For now, odds slightly favor sideways to up after a small pullback.
- However, if the bears get consecutive bears bar closing near the low, odds will swing in favor of a test of the February low and possibly a breakout below.
Trading room
Traders can see the end of the day bar-by-bar price action report by signing up for free at BrooksPriceAction.com. I talk about the detailed Emini price action real-time throughout the day in the BrooksPriceAction.com trading room. We offer a 2 day free trial.
Market analysis reports archive
You can access all reports on the Market Analysis page.


Thanks for the report. March Open/Close is engulfing February Open/Close. If you eliminate the high/low of both months you get an OO patent that is a BO mode. How valid such a view can be?
Hey Eli, thanks for reading the report.
What you have mentioned is a valid point, but leaving out the tails just because we want to find a narrative to fit our story may not be the right approach.
The tails themselves are details and gives us some information too.
Generally, overlapping = trading range.
If you are thinking BO, then your mind might be looking for a big BO move, and not Trading Range which is what it is now.
There are tens of other factors that I could have pointed out and wrote a 5 page report. The hard part about writing is to keep it simple, and just write what is important for the readers.
Hope this helps.
Have a blessed week ahead.
Best Regards,
Andrew
Thanks Brad, I should have been more clear. Personally I never ignore info from tops and bottoms of bars but Al in the room mentioned that institutions are using line charts made of closes only thus wondering how they behave when they see March engulfing February and closing above February close?