Trading Update: Friday February 23, 2024
S&P Emini pre-open market analysis
Emini daily chart
- The Emini gapped up yesterday and closed above the February 12th high.
- Today will probably disappoint the bulls as traders will likely use yesterday to take partial profits on longs.
- The daily chart is in a bull channel, which will likely transition into a trading range.
- Traders are becoming more interested in buying closer to the moving average and selling when the price gets far from the moving average.
- The bulls are hopeful that yesterday is the start of a successful bull breakout of the bulls channel that will lead to higher prices. While this is possible, the daily chart will likely continue to go sideways.
Emini 5-minute chart and what to expect today
- Emini is up 16 points in the overnight Globex session.
- The Globex market went sideways during the overnight hours and recently broke to the upside.
- At the moment the market is likely to get a gap up. However, traders should expect a trading range open.
- The bulls will probably get a small second leg up, which is common when the market gaps up.
- Most traders should assume that today will have a lot of trading range price action and consider not trading for the first 6-12 bars.
- Because the market will likely gap up, traders should be mindful of a possible opening reversal down and an early low of the day. More likely, a trading range will form.
- Traders should pay attention to yesterday’s high as it will likely be a magnet. Bulls will want today to close above it, and the bears will want the opposite.
Yesterday’s Emini setups

Al created the SP500 Emini charts.
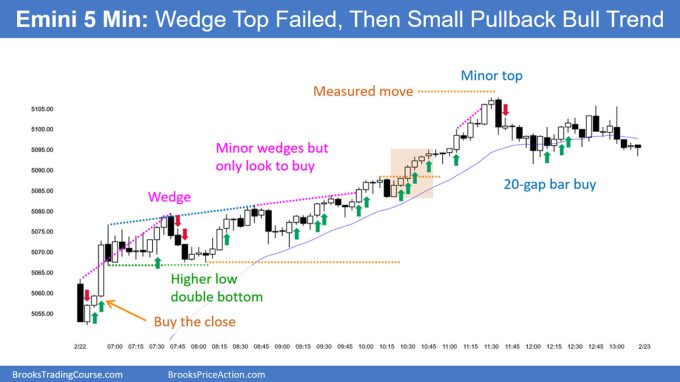
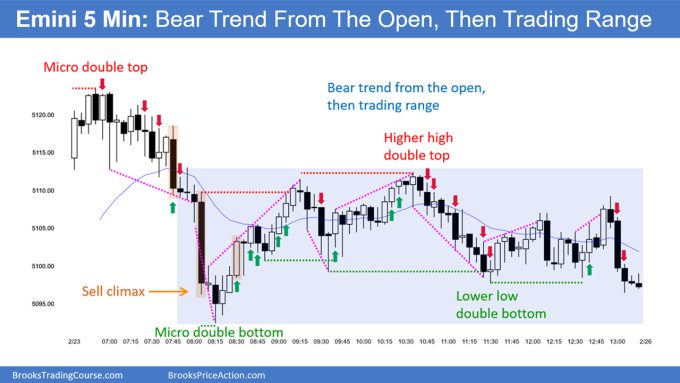
Here are reasonable stop entry setups from yesterday. I show each buy entry bar with a green arrow and each sell entry bar with a red arrow. Buyers of both the Brooks Trading Course and Encyclopedia of Chart Patterns have access to a near 4-year library of more detailed explanations of swing trade setups (see Online Course/BTC Daily Setups). Encyclopedia members get current daily charts added to Encyclopedia.
My goal with these charts is to present an Always In perspective. If a trader was trying to be Always In or nearly Always In a position all day, and he was not currently in the market, these entries would be logical times for him to enter. These therefore are swing entries.
It is important to understand that most swing setups do not lead to swing trades. As soon as traders are disappointed, many exit. Those who exit prefer to get out with a small profit (scalp), but often have to exit with a small loss.
If the risk is too big for your account, you should wait for trades with less risk or trade an alternative market like the Micro Emini.
EURUSD Forex market trading strategies
EURUSD Forex daily chart
- The EURUSD formed a bull bar above the moving average. However, it was a doji, which is a sign that the bulls are not strong.
- The bears are losing control, which increases the odds that the market is evolving into a trading range and is no longer in a bear trend.
- The bulls need to do more to clearly make the market Always In Long.
- At the moment, there are probably buyers not far below. However, bears will sell the first attempt above the moving average.
- The bears stop the bulls from getting a series of closes above the moving average. If the bulls can get several closes above the moving average, it will increase the odds of higher prices.
Summary of today’s S&P Emini price action

Al created the SP500 Emini charts.
See the weekly update for a discussion of the price action on the weekly chart and for what to expect going into next week.
Trading Room
Al Brooks and other presenters talk about the detailed Emini price action real-time each day in the BrooksPriceAction.com trading room days. We offer a 2 day free trial.
Charts use Pacific Time
When times are mentioned, it is USA Pacific Time. The Emini day session charts begin at 6:30 am PT and end at 1:15 pm PT which is 15 minutes after the NYSE closes. You can read background information on the market reports on the Market Update page.


Question. For Friday, why not a potential long above bar 9 on bar 10? You could make the argument we are in a potential trading range however with the short below bar 10 on bar 11 we would have also been in a trading range. I also see the argument that the trend could end soon. However, on Thursday the Emini gapped up 67.5 points and then continued a relentless bull trend all day.
Also why not a H1 entry above bar 3 on bar 4 and/or a H2 entry above bar 5 on bar 6? I can see the potential reasoning for fading the H2 since we would have seen 4 bars on the day at this point with alternating bull and bear bars which makes it look more like a Trading Range but why no H1? Also 2/3 bars of the day are good bull bars closing on their highs.
Any input would be greatly appreciated. Thanks in advance!
After Thursday, the higher probability Price Action to expect Friday is a TR. With the market opening above the EMA it is better to expect a pullback to at least test the EMA so I would prefer short trades to long trades at that point. Once the market touched the EMA at bar 13 Al did indicate a long trade above bar 14 which ended up failing.
How come the bar 14 H3 / wedge bottom at the 20 EMA wasn’t a reasonable buy for the opening swing?
Bar 14 was a signal bar for a long trade. That is why there is a green arrow below bar 15. The trade triggered when bar 15 went above the H of bar 14 but failed as the market sold off and bar 15 went outside down. Bar 15 ended up as a signal bar for a short trade that triggered on bar 16 which has the red arrow above it showing a short entry.
Thanks Andrew. I’m still adjusting from the boxes to the arrows and missed the arrow for B14.
It can get more confusing when the trade doesn’t trigger until a few bars after the signal bar because you are only seeing the entry bar marked but not the signal bar.