Trading Update: Tuesday January 9, 2024
S&P Emini pre-open market analysis
Emini daily chart
- The Emini formed a strong bull breakout yesterday. This was due to the bears giving up on the idea of a downside breakout below the moving average on the daily chart.
- While yesterday was a surprise, the odds favor disappointing follow-through buying today.
- Once the bears got down to the moving average, the odds favored a trading range and not a bear trend.
- I mentioned over the past couple of blogs that the Emini was probably going to bounce for a day or two and that there would be sellers above on any pullback.
- My concern for the bears is what Is happening right now. Some bears sold the high last Friday and are now trapped, holding a losing short position.
- This increases the odds of the first reversal down-finding buyers. This is due to the trapped bears who will use any pullback to buy back shorts of a reduced loss.
- The bulls have an opportunity to get follow-through buying today, further trapping the bears into a losing trade. It is worth mentioning that there are also trapped bulls who are trapped out of a winning long. They will look to buy on any pullback.
- The bulls see the high of last year (December 28th) and the March 2022 high, as both magnets are not far above. This increases the odds that the market will get a buy vacuum test of these magnets before traders look to sell.
- It is important to realize that the market has been in a trading range since mid-December, and yesterday was a big bull bar in the middle of the range. This will increase the risk of bad follow-through buying today and the bulls having to hold through a deeper pullback than what they want.
- Today will give traders a lot of information about what is to follow. If today’s follow-through is disappointing, it will confirm that the market still sees the past 14 bars as a trading range (including yesterday).
- Overall, the odds favor a second leg up. Bears are likely not eager to sell due to the strength of yesterday’s closing on its high.
Emini 5-minute chart and what to expect today
- Emini is down 28 points in the overnight Globex session.
- The Globex market sold off during the overnight session.
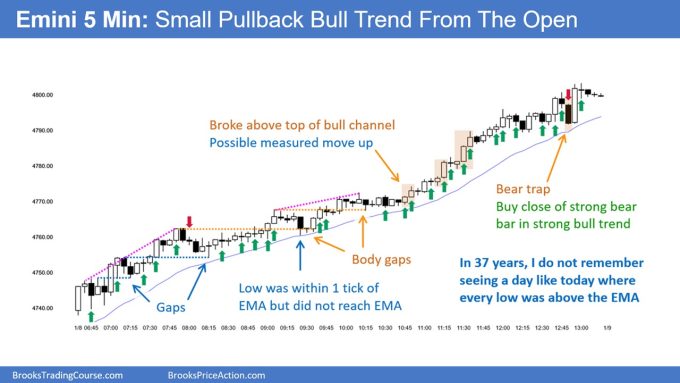
- Yesterday was very climactic. The market did not reach the moving average all day. This happens maybe 1% of the time, and I cannot remember the last time the market failed to reach the moving average during an 81-bar rally. This is a sign of climatic behavior and increases the odds that today will not be a bull trend day.
- Since yesterday was climactic, there is a 75% chance of a trading range open lasting two hours, beginning before the end of the second hour.
- There is a 50% chance of follow-through buying on the open and only a 25% chance of a bull trend from the open.
- Traders should expect the open to have a lot of trading range price action and for the market to go sideways. Most traders should consider not trading for the first 6-12 bars of the day unless they are comfortable making quick decisions since most breakouts fail on the open.
Yesterday’s Emini setups

Al created the SP500 Emini charts.
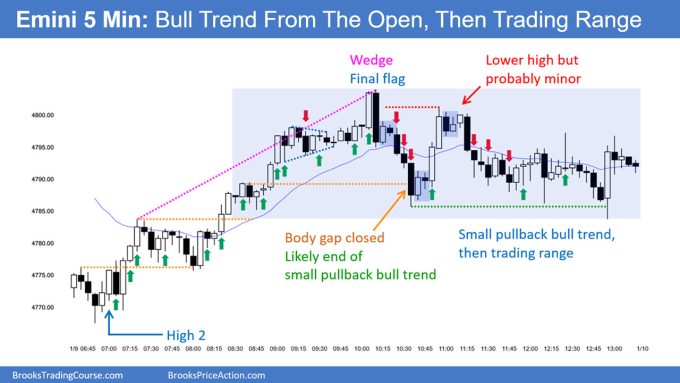
Here are reasonable stop entry setups from yesterday. I show each buy entry bar with a green arrow and each sell entry bar with a red arrow. Buyers of both the Brooks Trading Course and Encyclopedia of Chart Patterns have access to a near 4-year library of more detailed explanations of swing trade setups (see Online Course/BTC Daily Setups). Encyclopedia members get current daily charts added to Encyclopedia.
My goal with these charts is to present an Always In perspective. If a trader was trying to be Always In or nearly Always In a position all day, and he was not currently in the market, these entries would be logical times for him to enter. These therefore are swing entries.
It is important to understand that most swing setups do not lead to swing trades. As soon as traders are disappointed, many exit. Those who exit prefer to get out with a small profit (scalp), but often have to exit with a small loss.
If the risk is too big for your account, you should wait for trades with less risk or trade an alternative market like the Micro Emini.
EURUSD Forex market trading strategies
EURUSD Forex daily chart
- The EURUSD continues to go sideways in a tight trading range at the moving average.
- The Bears want a second leg down following the late December selloff.
- The bulls want a deeper pullback and a test of the December 27th bull close. The bulls who bought on December 27th were disappointed by the follow-through (December 28th) and never had a chance to exit breakeven. This increases the chance that the market will allow them to break even, meaning it may test back up to the December 27th close.
- The bull who bought December 27th likely scaled In lower, knowing that there is an 80% chance the market will rally enough to allow the bulls out breakeven on the entire trade instead of reaching the December 28th close.
- Overall, the market is in a trading range, and traders should expect more sideways trading to continue.
Summary of today’s S&P Emini price action

Al created the SP500 Emini charts.
End of day video review
End Of Day Review will be presented in the Trading Room today. See below for details on how to sign up.
See the weekly update for a discussion of the price action on the weekly chart and for what to expect going into next week.
Trading Room
Al Brooks and other presenters talk about the detailed Emini price action real-time each day in the BrooksPriceAction.com trading room days. We offer a 2 day free trial.
Charts use Pacific Time
When times are mentioned, it is USA Pacific Time. The Emini day session charts begin at 6:30 am PT and end at 1:15 pm PT which is 15 minutes after the NYSE closes. You can read background information on the market reports on the Market Update page.


General question. Do you recommend or do you think most traders enter with the same risk amount on all trades? I am not counting scale in traders who obviously manage risk differently from swing traders.
Hi Randall,
Difficult to talk for most traders but every trade you take should be with “no more than” your acceptable risk. So yes, in a way, all trades could use a stop representing “your” acceptable risk. This might be 1-2% of your available trading capital.
Bear in mind that “available trading capital” could well be a lot more $ than what you hold with your broker trading account. If so, be sure to maintain your trading account balance at an adequate level.
If you mean risk as defined by the size of the stop then that will vary. A high probability trade like a strong breakout will require a bigger stop than the more usual 40-60 percent trades. This is why Al always says to trade smaller if the stop is big so your risk amount remains similar.