Trading Update: Thursday July 21, 2022
Emini pre-open market analysis
Emini daily chart
- The bulls got a follow-through bar following the July 19 bull breakout. They hope today will be another bull close which would create consecutive bull closes above June 28 and increase the probability of higher prices.
- Yesterday was also a close above the June 28 high.
- At the moment, this is looking good for the bulls; they have a 5-bar bull micro channel following the July 14 high low major trend reversal.
- The bulls need another bull close today above June 28 to make the probability favor the bulls for higher prices. While the micro channel is good, and the bulls have consecutive bull closes above July 8, the June 28 high is more important. It is the final neckline of the double bottom (June 30, July 14).
- The bears want to disappoint the bulls today and get a bear close, preventing consecutive bull closes above the June 28 high. They hope today is a big bear bar closing below the previous day.
- Even if the bears get that, they still have the problem of a 5-bar bull micro channel which would reduce the probability of the first reversal down being successful.
- The market still might be forming a double top with the June 28 high, so traders need to be careful if the bulls get a bear bar today, especially if it is strong.
- Targets above for the bears are the 4,000 big round number and the June major lower high (June 2). The bulls want to get above the June major lower high because that would end the argument of the market being in a bear trend, which would make the market either in a bull trend or a trading range.
- The bears still wanted a double top with the June 28 high, a breakout below the neckline (July 14), and a measured move below the June low. Even if the market gets below the June 17 low, the odds will favor buyers below.
- The market is trying to form consecutive wedge bottoms on the daily chart. (For more information, see the past couple of daily blog posts regarding the consecutive wedge bottoms).
Emini 5-minute chart and what to expect today
- Emini is up 6 points in the overnight Globex session.
- The market has been sideways for most of the Globex overnight session.
- The odds favor a trading range open, so traders should expect limit order trading until there is a clear breakout with follow-through.
- As I often say, most traders should wait for 6-12 bars (especially if the market is sideways and confusing). This is because most breakouts fail on the open, so getting caught on the wrong side can be easy. Also, there is a 50% chance that the first move up/down will completely reverse.
- If there is going to be a strong trend, there will be plenty of time to enter the trade, so no rush to enter the market (most of the time) during the first 6 bars.
- Traders should pay attention to the open of the day, especially if in the middle of the range. The reason is that the market could get a strong breakout up or down late in the day.
- Also, traders need to pay attention to June 28 high as it will likely be an important price level.
- Lastly, if there is a strong breakout, traders cannot be in denial, and they need to find a way to enter in the direction of the breakout or on a pullback.
Yesterday’s Emini setups

Al created the SP500 Emini charts.
Here are several reasonable stop entry setups from yesterday. I show each buy entry with a green rectangle and each sell entry with a red rectangle. Buyers of both the Brooks Trading Course and Encyclopedia of Chart Patterns have access to a much more detailed explanation of the swing trades for each day (see Online Course/BTC Daily Setups).
My goal with these charts is to present an Always In perspective. If a trader was trying to be Always In or nearly Always In a position all day, and he was not currently in the market, these entries would be logical times for him to enter. These therefore are swing entries.
It is important to understand that most swing setups do not lead to swing trades. As soon as traders are disappointed, many exit. Those who exit prefer to get out with a small profit (scalp), but often have to exit with a small loss.
If the risk is too big for your account, you should wait for trades with less risk or trade an alternative market like the Micro Emini.
EURUSD Forex market trading strategies
EURUSD Forex daily chart

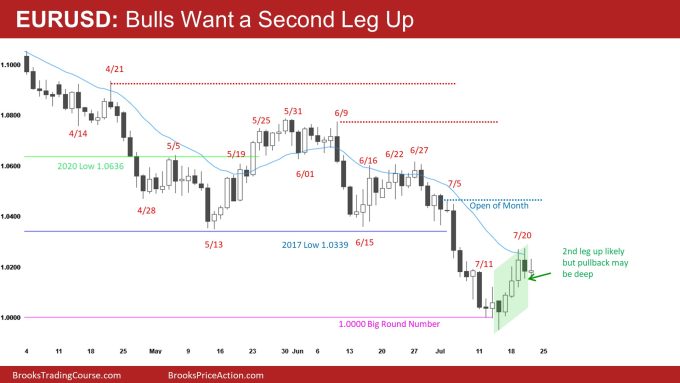
- The bears got a bear close yesterday following a moving average test.
- The tail below yesterday’s bear bar increases the odds of buyers below, especially since the bulls have a 5-bar bull micro channel.
- Yesterday may have been profit taking by the traders who bought the 1.0000 big round number and scale in bulls who bought the 2017 low and lower (exiting breakeven on the entire trade). The bears know this, so that they will sell for a quick scalp.
- The bulls need to break above the moving average soon, or else the risk goes up of some form of a micro double top and a retest of the low closes and the 1.0000 big round number.
- The odds still favor a test of the 2017 low and bottom of the May – June trading range. Both were good locations for bulls to buy if they were willing to use a wide stop and scale in lower. This means the market will likely come back to its original entry prices.
- Also, the odds favor the May – June trading range becoming a final flag.
- Bears want a measuring gap with the May – June trading range. However, it is not likely. They also want a test of the low close and 1.0000 big round number; however, the odds favor a higher low and second leg up. That could change if the market continues sideways here.
- Overall, traders should expect a sideways up for the next few days.
Summary of today’s S&P Emini futures price action and what to expect tomorrow
- Al will post chart after the close.

Al created the SP500 Emini charts.
End of day summary
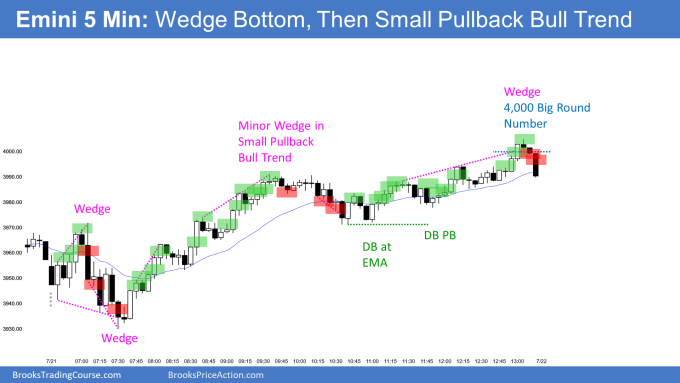
- The market formed a wedge bottom on the open, leading to a small pullback bull trend day.
- The market reversed multiple times on the first four bars, which was a sign of a trading range open.
- the bull breakout on bar 5 had bad follow-through (bar 6), which increased the odds of the rally above bar 6, leading to a failed bull breakout and a wedge top.
- The outside down bar at bar 8 was a surprise and likely to lead to a second leg down. However, the bar was big, which means a bad risk reward. Also, the market is in a trading range, so if bar 9 is a bad follow-through bar, bears may scalp out disappointed, which is partly why the market reversed up over the next 7 bars.
- The bulls got a strong breakout above the moving average, and the market became a small pullback bull trend.
- It is important to realize that bulls are buying because they are confident the first reversal down will be bought, so one can trade small and use a wide stop and likely avoid a loss (better if they can buy more lower).
- Notice how almost every bull bar closing near high after the first hours was retested. This means that a trader could have bought any strong bull close and gotten out breakeven if disappointed by the follow-through. T
- The reasons why traders are not worried about buying on the way up is because they know the odds favor a trading range and not a bear trend.
- Overall, today was a great day for the bulls on the daily chart.
- The market now has two consecutive closes above the June 28 high, increasing the odds of higher prices and a test of the June major lower high (June 2).
See the weekly update for a discussion of the price action on the weekly chart and for what to expect going into next week.
Trading Room
Traders can see the end of the day bar-by-bar price action report by signing up for free at BrooksPriceAction.com. Al talks about the detailed S&P Emini futures price action real-time throughout the day in the BrooksPriceAction.com on trading room days. We offer a 2 day free trial.
Charts use Pacific Time
When times are mentioned, it is USA Pacific Time. The Emini day session charts begin at 6:30 am PT and end at 1:15 pm PT which is 15 minutes after the NYSE closes. You can read background information on the market reports on the Market Update page.


Brad hey, thanks for your report. June 28th cant be the neckline for June 30th and July 14 DB unless I’m missing something? Could be you refer to June 17th or June 22nd that was the H2?
June 28 is the neckline of the double bottom. The lows of the double bottom are June 30th and July 14. July 14 was a H2 buy (all H2s are double bottoms), and the market broke above the top of the Range (June 30), which is the neckline of the double bottom. Remember, all Trading Ranges are double bottoms and double tops.
After many wedge bottoms on the daily chart some days I see wedge bear flags are formed, then either Leg 1/PB/Leg 2 occurs or bear trap inside bar and eventually strong rally and bull breakout above wedge bear flag then test of the trend’s extreme. I am waiting to see if it is forming wedge bear flag. However, on the weekly chart wedge bottom not completed yet I guess