Trading Update: Wednesday April 27, 2022
Emini pre-open market analysis
Emini daily chart
- The Emini bulls want a micro double bottom and bounce today. They will likely get a bull close due to the bears reaching the target of the March 14 low.
- If today closes near its high, it could set up a credible micro double bottom on the daily chart, which may be enough for the bulls to test the April 18 breakout point.
- The next target for the bears is the February low which it will probably reach.
- April 25 was a strong bull bar closing on its high and a reminder that the market is still in a trading range on the daily chart.
- The bears have a 4-bar bear microchannel, so the first reversal up will likely be minor.
- Even though the bears will likely test the February low, traders have to remember that the market is in a trading range and that the odds favor the failed breakout below February, which is why I bring up the point about the market reaching the April 18 breakout point low.
- There is the possibility that the bulls give up below February, and if that happens, the Emini could sell off quickly down to 4,000 or a measured move down of the February – March trading range testing 3,600.
- Overall, today will likely gap up and close as a bull day. The bulls want as big of a bull bar as possible, and the bears want to make any bull close as disappointing as possible or even get a bear close.
Emini 5-minute chart and what to expect today
- Emini is up 25 points in the overnight Globex session.
- As stated above, today will probably close above the open.
- The Emini rallied for most of the Globex session and had a sharp reversal down around 12:00 AM PT and rallied back to the Globex high around 2:00 AM PT. This was the beginning of a likely trading range forming.
- Traders should be open to the possibility of a bull trend from the open or a small pullback bull trend day.
- If a bear selloff looks weak, traders will look to fade it.
- As always, most traders should consider waiting for a credible stop entry or strong breakout with follow-through.
Yesterday’s Emini setups

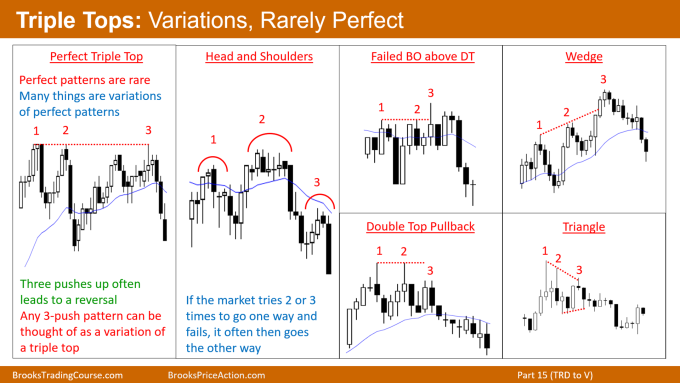
today I am including a sample general information slide from the Encyclopedia below.

Al created the SP500 Emini charts.
Here are several reasonable stop entry setups from yesterday. I show each buy entry with a green rectangle and each sell entry with a red rectangle. Buyers of both the Brooks Trading Course and Encyclopedia of Chart Patterns have access to a much more detailed explanation of the swing trades for each day (see Online Course/BTC Daily Setups).
My goal with these charts is to present an Always In perspective. If a trader was trying to be Always In or nearly Always In a position all day, and he was not currently in the market, these entries would be logical times for him to enter. These therefore are swing entries.
It is important to understand that most swing setups do not lead to swing trades. As soon as traders are disappointed, many exit. Those who exit prefer to get out with a small profit (scalp), but often have to exit with a small loss.
If the risk is too big for your account, you should wait for trades with less risk or trade an alternative market like the Micro Emini.
EURUSD Forex market trading strategies
EURUSD Forex daily chart

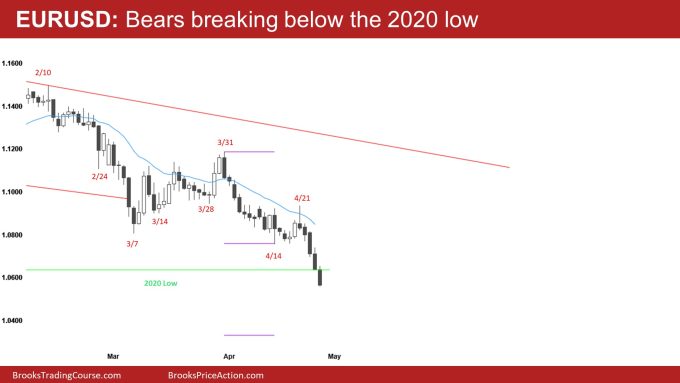
- The bears have had a series of strong bear closes on the daily chart and have broken below the 2020 low (1.0636) and want to close below it today.
- The market is clearly Always in Short, and the first reversal up will likely be minor. While the market may have to pullback soon, the odds of a reversal are small without the market going sideways and forming at least a micro double bottom.
- The bears want a measured move down from the March – April trading range, which is around 1.0330. This measured move projection would take the market down to the 2017 low, which is the low of the past 20 years.
- The bulls hope this will be similar to March 7 and reverse back into the March – April trading range. The difference here is the bear bars are stronger than the March 7 sell-off, and the market is trying to break below obvious support (2020 low).
- Overall, the market will likely bounce soon due to profit-taking, and the best the bull can hope for is a minor reversal.
Summary of today’s S&P Emini futures price action and what to expect tomorrow

Al created the SP500 Emini charts.
End of day summary
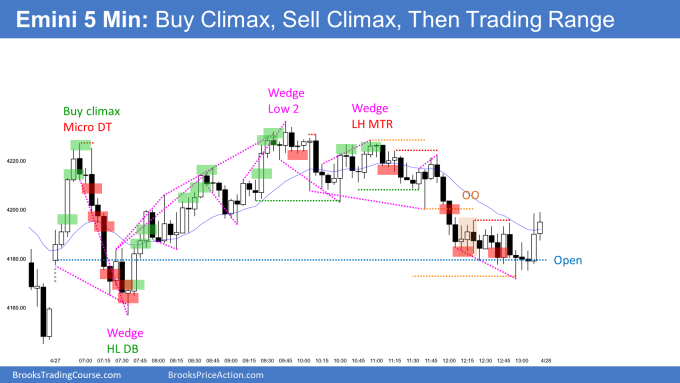
- Today had a buy climax on the open and a selloff that tested yesterday’s close.
- When the market makes a strong move up or down on the open and reverses as it did around bar 5, the odds favor a trading range and not an opposite trend. This means the odds favored a failed bear breakout below bar 1.
- Overall, today was a trading range day with many sideways limit order trading.
- When the open of the day is close to the middle of the range, and the market is late in the day, one should be open to the possibility of a test of the open as it did around 2:15 PT.
- Today closed as a small bull doji on the daily chart, which is a buy signal bar for the micro double bottom with 4-/25. However, today is a reminder that the bears are strong, and any bounce the bulls get will likely be minor and go sideways.
- The bears ultimately want to get down to the February low.
See the weekly update for a discussion of the price action on the weekly chart and for what to expect going into next week.
Trading Room
Traders can see the end of the day bar-by-bar price action report by signing up for free at BrooksPriceAction.com. Al talks about the detailed S&P Emini futures price action real-time throughout the day in the BrooksPriceAction.com on trading room days. We offer a 2 day free trial.
Charts use Pacific Time
When times are mentioned, it is USA Pacific Time. The Emini day session charts begin at 6:30 am PT and end at 1:15 pm PT which is 15 minutes after the NYSE closes. You can read background information on the market reports on the Market Update page.


Hello, I personally always have this battle of whether to sit thru a PB or get out below a bear bar. For example to get out below bar 5 (or 6 here as noted from the commentary; which makes me more confused that it is a doji) unless given that on the open reversals are more likely to fail. I did not get out until below 7.
Yet when 17 appeared I was very quickly to get out in fear of a LH and more down, clearly didn’t happen.
My question is what is everyone’s defaults for getting out. I know Al says 5-6 ticks below a bull bar or 1-2 ticks below a bear bar. I appreciate the feed back from all thx
I personally set my stop below the previous major low. In this case, it was one tick below the bear bar from just before yesterday’s close
I understand that is where Al initially places his stop “worse case stop” however, are you holding with that stop in place? The point I am trying to make is if you BTC on bar 3 your stop is below 1, (initially) Al says to get out early. Early however is subjective because Al is quick to get out yet sometimes sit thru PB’s. This is where my intuition is very foggy.
For you tho you are saying you are holding that stop until either your profit target is hit or your are stopped out?
Yeah for my style I’m setting my stop and my target and I’m holding through it. I’m either right or I’m wrong, and I’ve already accepted my risk and reward. I’ll be wrong sometimes and right others, but I’m profitable as long as the trader’s equation makes sense.
Being that Al is a bit more advanced of a trader, he can make quicker decisions and get in and out of trades. I don’t trust myself to make accurate decisions multiple times a day, so I try to take fewer, high probability trades, and sit through the breakouts and pullbacks until either my stop hits, or my target hits.
Since my SL was so far from my entry today, I played a smaller position (micros instead of minis). In general, I try and size my position based on the total risk, this way, no matter how far the SL is away from the entry, I’m always risking the same amount.
Fair enough Camrin. However, I notice in Al’s bar-by-bar analysis in his BrooksPriceAction website, he is fairly consistent about the AIBRE and AIBLE early exits.
How do you get access to the bar-by-bar analysis?
BrooksPriceAction.com (create account) > Forums > Trading > Trading Updates from Al Brooks > Topics [select trading day]
Notes
• No Webinar day = no bar-by-bar analysis posting
• Bar-by-bar questions should not be asked here when posted on Brooks Price Action (to save time for the much appreciated contributors that write the daily analysis).
If you Google Brooks price action the link should appear.
… Al sometimes refers to the similar early exit BLE4 and BRE4 (instead of the AIBLE and AIBRE). They are somewhat similar.
I use a wide swing stop as my initial stop but will exit as soon as I think the Always In direction has changed or when my premise is no longer valid. So on today’s open I would have exited while bar 9 was forming, since at that point I was certain the market was Always In Short or below 5 since on the open, 50% of the initial moves fail.
I don’t use tight stops as Al has been lately advising, since for me it is difficult to get back into the market and I easily get upset if I exit based on a tight stop and then the market continues in my direction.
James, if you exited below 17 then you have to re-enter above a bull bar closing on its high, such as 22. But then do you see 22 as a BO for a Failed L2 with 20 or do you see 22
as a buy climax at the top of a tight trading range? For me it is difficult to say and difficult to re-enter again. And if you don’t re-enter then you missed the bull trend from which you just exited.