Monthly S&P500 Emini futures candlestick chart:
Emini bull trend resumption after buy climax and triangle
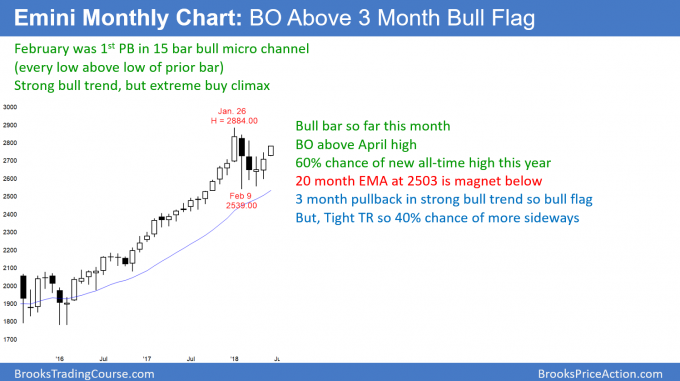
The monthly S&P500 Emini futures candlestick chart is breaking above a 3 month bull flag. This month so far is the 3rd consecutive bull trend bar.
The monthly S&P500 Emini futures candlestick chart is breaking above a 3 month bull flag in a strong bull trend. But, the bears want a double top after the 15 month buy climax. However, after a 15 month bull micro channel, there is a 70% chance of at least a new small new high before the bears can take control. This is true even if the Emini forms a lower high within the next few months and a break below the February low. Since 3,000 is a Big Round Number and just above the old high, that is a minimum goal over the next 3 – 6 months.
Weekly S&P500 Emini futures candlestick chart:
Rally should test above 2800 within a few weeks
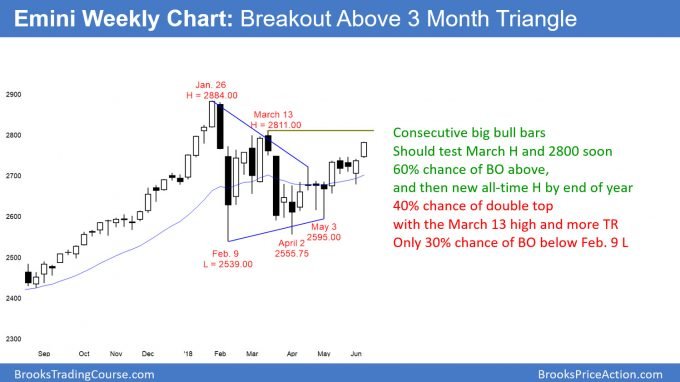
The weekly S&P500 Emini futures candlestick chart has rallied strongly for 2 weeks after pulling back from a breakout above a triangle. The odds are that the Emini will test the 2800 Big Round Number and the March 13 high within a few weeks.
The weekly S&P500 Emini futures candlestick chart has rallied from the May 3 low at the bottom of a 3 month triangle. Since the weekly chart was in a strong bull trend before the triangle formed, the odds favor bull trend resumption.
A breakout above a triangle often continues for a measured move up. Since the triangle is about 300 points tall, the current rally could reach 3100 – 3200 over the next 6 months.
Triangle late in bull trend is usually the Final Bull Flag
The current trend on the weekly chart began in early 2016. It therefore was in effect for about 100 bars when the buy climax evolved into the triangle in February.
It is important to realize that a triangle late in a bull trend is usually the Final Bull Flag. This means that the breakout above the triangle usually reverses back down to the apex or bottom of the triangle. While the odds favor a rally over the next 6 months or so, there will then likely be a reversal back down to around 2600.
Traders should not lose sight of the fact that this rally will likely continue for at least 10% above the 2700 apex of the triangle. Therefore, traders should continue to look to buy over the next many months.
Double top lower high major trend reversal (DT LH MTR)
Even though the bull trend is resuming, the weekly chart is still in a 5 month trading range. Consequently, there is always a reasonable bear case. They want this rally to reverse down from a double top with the May 13 high. That would be a double top lower high major trend reversal.
If there is a strong reversal down, the bears would have a 40% chance of a swing down to the bottom of the triangle. In addition, there would be a 30% chance of a break below the February low and a 300 point measured move down to 2301.00.
Daily S&P500 Emini futures candlestick chart:
Pausing around March major lower high ahead of next week’s FOMC meeting
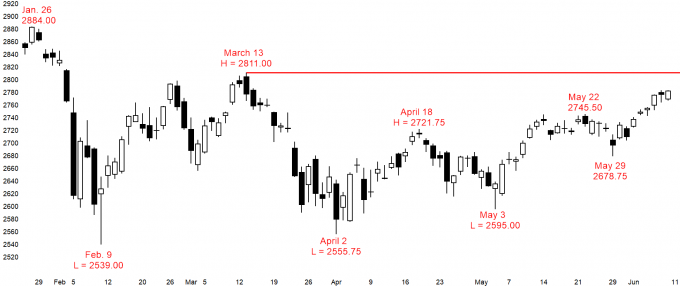
The daily S&P500 Emini futures candlestick chart has rallied strongly since May 3. It might pause around the March 13 major lower high going into Wednesday’s FOMC announcement.
The daily S&P500 Emini futures candlestick chart has been in a bull trend since the May 3 low. Since the next resistance above the April 18 high is the March 13 high of 2811.00, the market is getting vacuumed up there quickly.
Because that is major resistance, the Emini will likely stall there or even pull back for a week or two. But, there is a 60% chance of a breakout above that high within the next couple of months. This is true even if there is a reversal back down to the May 29 low of 2678.75.
What will the rally to 3,000 look like?
The Emini will probably rally to above 3,000 before the end of the year. However, 3,000 is not that much about the current price, and there are almost 7 months left to the year. Consequently, the Emini will probably spend a lot of time in 2 – 4 week pullbacks as it channels up to the target. Each pullback will look like the start of a bear trend. But, as long as the Emini continues to make major higher lows, the bull trend will still be in effect.
The most recent major higher low is the May 3 low of 2595.00. That is about 200 points below the current price. Traders must realize that there can therefore be very deep selloffs over the next 6 months in the bull channel. As long as the selloffs stay above the most recent major higher low, the bull trend is still intact. Therefore, the selloffs will be pullbacks and buying opportunities.
But, if there is a strong break below a major higher low, the bull trend will be over. The Emini would then be back in a trading range and possibly even a bear trend.
Traders can see the end of the day bar-by-bar price action report by signing up for free at BrooksPriceAction.com. I talk about the detailed Emini price action real-time throughout the day in the BrooksPriceAction.com trading room. We offer a 2 day free trial.
When I mention time, it is USA Pacific Standard Time (the Emini day session opens at 6:30 am PST, and closes at 1:15 pm PST). You can read background information on the intraday market reports on the Intraday Market Update page.


Al,
I have an inquiry regarding your trading style, according to what I read from your talks and self-introduction in the past years, it looks to me you were an almost 100% scalper (when you started to be consistently profitable), and then you started taking occasional swing trades after being more confident and calm, though most of your trades are still scalp, is that the case?
Thanks,
There are usually only 1 – 3 swing trades a day. Therefore, anyone taking 10 or more trades a day is mostly scalping, and most of my trades are scalps. Yet, I think it is easier to become consistently profitable looking for 1 – 2 swing trades a day. As traders become more experienced, they see more things. Many then take more trades, which means they add scalping to their swing trading.
Thanks Al,
I am asking because it is actually difficult for me to sit tight for a swing (I trade HSI futures by the way, which is quite volatile), and my personality prefers high winning rate and less exposure to the market, which would be good for my mental status. After following your scalping method over the past years, I do see more and more things and getting calmer, thus I think I may add swing to scalper later, instead of the other way around, does that make sense to you?
Yes, it does. I think most traders would find it easier to try to become profitable with swing trading before moving to mostly scalping. However, I understand the personality side of it.
My belief is that a successful career as a trader requires two thing. First, he must be consistently profitable. Next, and just as important if a trader is planning on doing this for decades, he must be happy. That means he has to discover a trading style that is compatible with his personality. Some traders have a scalper’s personality. The trick is to become profitable, given that reality. It is simply easier to do as a swing trader.
Hi Al,
Your videos and course is extremely helpful. I am learning a lot.
I had a question to ask you.. these days due to low vol range of movement in SP500 is small while individual stocks are making lot of moves. This allows traders to grow their account relatively quicker if they focus on stocks. I was wondering if you apply similar methods to stocks as well?
Also please let me know if I am correct in concluding making money from SP500 is now relatively difficult and if yes, why do you still prefer trading SP500.
Thanks for your help,
I use the same approach to trading stocks, crude oil, gold, Forex, and cryptocurrencies.
All markets constantly change, and traders have to adapt. Early this year when the ranges were big, I said that they would soon get small. Late last year when they were small, I said they would soon get big. Most people find it easier to trade big swings and big bars. However, with experience, traders discover that they can make money in any market, big or small, stocks or futures. I agree that it is more work when the ranges are small and there are lots of reversals, but there are still many good setups every day.
Cool thanks for your feedback. You are indeed an extraordinary teacher and trader 🙂