Monthly S&P500 Emini futures candlestick chart:
Strong follow-through buying
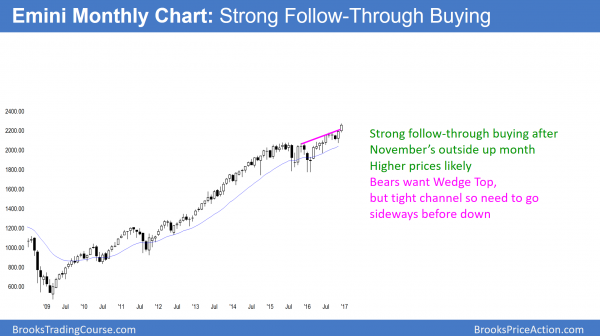
The monthly S&P500 Emini futures candlestick chart has a big bull bar with one week left to the month. Hence, this is good follow-through buying after last month’s bull breakout.
The monthly S&P500 Emini futures candlestick chart is in a bull breakout. Because the channel up since February is tight, bulls will probably buy the 1st reversal down. Hence, a reversal attempt will more likely create a bull flag than a bear trend. In addition, there are several measured move targets above 2300. Therefore the odds are that the Emini will go at least a little higher over the next few months.
Weekly S&P500 Emini futures candlestick chart:
Weak follow-through buying after buy climax
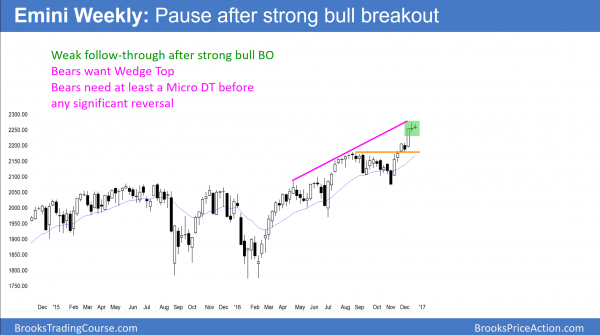
The weekly S&P500 Emini futures candlestick chart had a 2nd consecutive doji this week.
The weekly S&P500 Emini futures candlestick chart has had consecutive doji bars. Because these represent hesitation after the buy climax of 2 weeks ago, there is an increased chance of a reversal. Yet, they are part of an 8 bar bull micro channel. Hence, the bulls are are strong. Therefore, a reversal attempt will more likely create a bull flag than a bear trend.
Exhaustion gap or measuring gap?
There is a gap below this week’s low and the August high breakout point. This gap is after at least 20 bars in a bull trend (the trend began in February and hence has more than 40 bars). It is therefore more likely an exhaustion move than the start of a new leg up. Furthermore, the strong rally from July pulled back below its breakout point. As a result, the odds are that the Emini will pull back to around the August high before it gets too much higher.
Can it rally to the measured move targets 1st? Of course it can. But, whether is does or does not, the odds are the Emini will test around 2185 in the next few months.
Exhaustion usually leads to a pullback, not a reversal
Exhaustive buy climaxes usually lead to pullbacks and trading ranges that last 10 or more bars. They less often lead to trend reversals. When they do, the Emini usually has to go sideways for at least 5 – 10 bars and form at least a small double top. Hence, the downside risk over the next several weeks is probably to the 2175 breakout point. Bulls will probably buy any reversal attempt by the bears.
Daily S&P500 Emini futures candlestick chart:
Emini bull flag at Dow 20,000 big round number
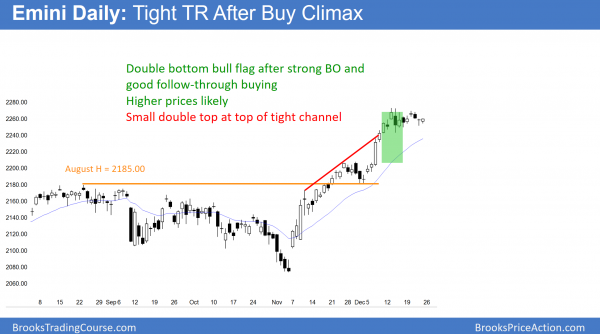
The daily S&P500 Emini futures candlestick chart has been in a tight trading range for 9 days. The bears see a small double top. The bulls see a double bottom bull flag.
The daily S&P500 Emini futures candlestick chart has been in a bull flag for 9 days. The odds still favor a bull breakout. Dow, 20,000 is especially relevant. The Dow got to within 13 points of its big round number this week. That is equivalent to about 1 point on the Emini. If the Emini makes a new all-time high next week, the Dow will probably get above 20,000.
Then what? Because the stock market is so far above its average price (moving averages), the upside near term is probably not great. Yet, the momentum up has been strong. As a result of the combination of strong bullish momentum and an overbought market, the stock market is confused. Because confusion is a hallmark of a trading range, the Emini will probably continue sideways, but in a broader range over the next week or two.
Buy climax so trading range likely soon
Since the the bull trend is strong, the odds are that it will make a new high within the next few weeks. It might even reach the measured move target between 2300 and 2400 over the next few months. Yet, the odds are that there is not much left to this rally before bulls will take profits. When they do, the Emini will probably enter a trading range lasting 20 or more bars.
Traders can see the end of the day bar-by-bar price action report by signing up for free at BrooksPriceAction.com. I talk about the detailed Emini price action real-time throughout the day in the BrooksPriceAction.com trading room. We offer a 2 day free trial.
When I mention time, it is USA Pacific Standard Time (the Emini day session opens at 6:30 am PST, and closes at 1:15 pm PST). You can read background information on the intraday market reports on the Intraday Market Update page.


Thank you for the weekend update. Merry Christmas and Happy New Year.
Merry Christmas, Al and everyone else!