Market Overview: S&P 500 Emini Futures
The S&P 500 Emini futures broke above December high this week, which the bulls hope was the last major lower high, thereby ending the bear trend of successively lower highs and lower lows. While some traders may view the December high as a major lower high, the bears want a break above the August high to be sure of the end of the bear trend.
S&P500 Emini futures
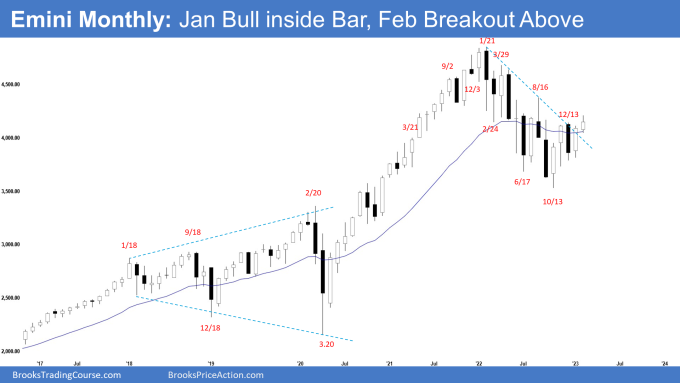
The Monthly Emini chart

- The January monthly Emini candlestick was an inside bull bar closing near its high, above the 20-month exponential moving average and the bear trend line.
- Last month, we said that December was a bear bar closing in the lower half and it is a weak buy signal bar for January. Traders will see if the bulls can create a second leg sideways to up, or if the bears can create a follow-through bear bar in January.
- The bears failed to create follow-through selling in January while the bulls have created a second leg sideways to up.
- The bulls see the selloff from January 2022 as a wedge bull flag (February 24, June 17 and October 13).
- They got a reversal up, followed by a pullback in December. They then want a second leg sideways to up, which is currently underway.
- Since January closed above the 20-month exponential moving average and the bear trend line, the bulls will need to create a follow-through bull bar in February to confirm the breakout.
- If they manage to do that, the odds of a retest of the August 2022 high increase.
- The move down since January 2022 had a lot of overlapping bars. The bears are not yet as strong as they hope to be.
- They see the move down from January 2022 as a broad bear channel, with the August 2022 high as the last lower high.
- While the bulls have broken the bear trend line, the bears hope that the recent move up is simply forming another lower high (to Aug 2022) with a flatter trend line.
- If the Emini trades higher, they want a reversal lower from a double top bear flag with the August 2022 high and a lower high major trend reversal.
- Since January was an inside bull bar closing near its high, the Emini is in breakout mode. The odds favor an upside breakout which it has done so in early February.
- The first breakout from an inside bar can fail 50% of the time.
- Traders will see if the bulls can create a follow-through bull bar in February, or if the Emini trades slightly higher, but reverses to close with a bear bar below the 20-month exponential moving average.
- The candlesticks in the last 8 months are overlapping between the range of 4300 and 3500 which means the Emini is in a trading range.
- Traders will BLSH (Buy Low, Sell High) until there is a breakout from either direction.
- Poor follow-through and reversals are more likely within a trading range.
- Until the bulls can break far above August 2022 high, the broad bear channel may still be in play.
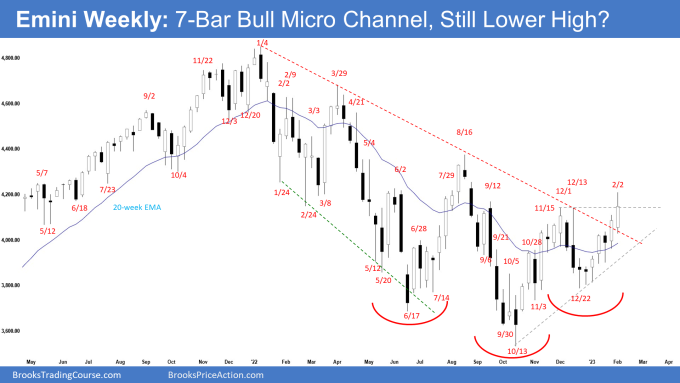
The Weekly S&P 500 Emini chart

- This week’s Emini candlestick was a big bull bar with a prominent tail above.
- Last week, we said that the odds slightly favor the Emini to still be in the second leg of a sideways to up phase.
- This week broke and closed above the December high. The bulls got follow-through buying following last week’s close above the bear trend line.
- The bulls got a reversal up from a higher low major trend reversal (Dec 22) and a double bottom bull flag (Nov 3 and Dec 22).
- The current move is the larger second leg sideways to up from the rally which started in October 2022.
- They see the last 6 months as forming an inverted head and shoulders, with the December low being the right shoulder.
- However, inverted head and shoulders pattern often ends up as bear flags instead of a reversal pattern.
- Currently, they have a 7-bar bull micro channel, which means persistent buying.
- The bulls broke above December high, which they hope was the last major lower high, thereby ending the bear trend of successively lower highs and lower lows.
- They need to create follow-through buying above December high and August high to signal the end of the selloff.
- The bears see the current move up simply as a continuation of the move which started in October 2022.
- They want a reversal from a lower high. If the Emini trades higher, they want a reversal lower from a double top bear flag with the August 2022 high.
- Because of the strong move-up, the bears will need a strong reversal bar or a micro double top before they would be willing to sell more aggressively.
- While some traders may view December high as a major lower high, the bears want a break above the August high to be sure of the end of the bear trend.
- Until the bulls can break far above the August high, the broad bear channel may still be in play.
- After the spike and broad channel down from January 2022, the Emini may have transitioned into a trading range phase between 4300 and 3500.
- The move up from October 2022 may simply be a bull leg within a trading range.
- Since this week was a bull bar with a prominent tail above, it is a weaker buy signal bar. It is a weak sell signal bar.
- Traders will see if the bulls can create follow-through buying following the breakout above the December high, or if the Emini trades stalls and reverses lower.
Trading room
Al Brooks and other presenters talk about the detailed Emini price action real-time each day in the BrooksPriceAction.com trading room. We offer a 2 day free trial.
Market analysis reports archive
You can access all weekend reports on the Market Analysis page.


Hi Andrew, the Dec high on weekly chart does qualify for a H and we had a MTR. The move down to Oct 22 looks like TR behavior (i.e.) a first leg down or even partial first leg down.
If its partial then perhaps mkt might turn at Oct resistance 42k. If its not then mkt may go to 44k to test Mat 22 resistance. After then 2nd leg down in TR and I would set Oct 20 32k as a target.
For now we’re up to Aug resistance
Dear Tom,
A good day to you again..
Yeah, it’s likely we are already in the trading range phase..
Will continue to monitor and see how things play out..
Wishing a great week ahead to you! 🙂
Best Regards,
Andrew
I consider the August H as the last LH. The December H does not qualify since there wasn’t a LL after it. After last week the December L is now a HL but the whole move is still only two legs up and therefore not a trend yet. Indecision? Yes. Must be a trading range!
Dear Andrew,
A good day to you..
I tend to agree.. the move up from Oct looks like a single swing up comprising of 2 legs..
Breaking above Aug would be a better factor to invalidate the weak bear trend..
And yes.. likely entering trading range phase..
Spike > Channel > Trading Range > BO Spike again
Have a blessed week ahead to you Andrew!
Best Regards,
Andrew
Thanks Andrew for your great report. Question re monthly wedge bull flag: Al in his annual review is more for TR going forward and doesn’t presives the current monthly wedge bull flag as a “real” bull flag per say, you have also mentioned this inside the report. Other than Feb monthly candlestick close on its high, what would you like to see to be convinced this is a real wedge bull flag that might test ATH extreme and event may go higher for a potential MM?
Dear Eli,
A good day to you too..
hmm.. good question.. let me think.. I would probably want..
1) good buying pressure – strong bull bars, consecutive bull bars closing near highs
2) pullbacks are weak on smaller time frames like Daily and Weekly charts
3) a strong break above Aug with follow-through buying
I would probably want to see these from the top of my head..
Wishing a blessed week ahead to you Eli!
Best Regards,
Andrew
The market could make a new ATH and still be in a broad trading range. The example that comes to mind is the Dow 30 in the late 60s & 70s.