Trading Update: Wednesday April 6, 2022
Emini pre-open market analysis
Emini daily chart
- The market broke above the February high during the U.S. day session for the second time. The bulls failed to keep the market above the February high, and the bears were able to successfully close the market below it.
- I stated yesterday that the rally up to March 29 was a possible parabolic wedge and that the market would likely get a second leg down after the first (March 31). It was possible yesterday was that second leg down.
- The bears have a low 1 short below April 4; however, it is a bull bar, which means probably buyers below. However, the Market is at the top of the February range, which increases the odds of a bear breakout testing the March 3 breakout point.
- At this moment, the market will probably continue sideways for at least a couple of days as the bulls try for a second entry buy and the bears try for a bear breakout.
- It is typical in a trading range to feel confused. The selloff from March 26 looks like a bull flag, and the bears look weak. The problem for the bulls is that the market is forming a bull flag just below obvious resistance (February high). If the bulls were mighty, they would not be forming a bull flag just below resistance.
- Think about it, why would the bulls be so eager to get to the high of February, break slightly above it, and hesitate right below it? This is the classic dilemma of trading ranges.
- Think about the bull case from a math standpoint:
- The bulls have a considerable risk to below the bottom of the trading range around March 14. Currently, there is not a 60% chance those bulls will make 1x their risk (300+ points above the current market price).
- This means traders have poor risk/reward and a probability of less than 60%, which is a losing trader’s equation.
- One way the bulls can improve their math is by tightening their stop to below a bull bar or bear bar, such as on March 30. That trader could exit and wait for a second entry buys at the top of the February range, such as today, if it closes as a strong bull bar.
- A bull could buy above the H2, have limited risk to the bottom of the high 2 and have around a 50% probability of a swing (maybe slightly lower). This would increase the risk-reward, and bulls would have at least a 40% chance of a swing profit.
Emini 5-minute chart and what to expect today
- Emini is down 45 points in the overnight Globex session.
- The bears got two big consecutive bear bars around 12:30 AM PT during the morning session. This led to a tight bear channel.
- The bears are hopeful they can get a large gap down on the open of the U.S. Day session and get a bear trend day.
- With market gapping down on the open, the bulls may buy aggressively and try to get a second entry to close on its high.
- On the open, traders should be open to the possibility of a trend from the open and look to trade with the trend if one side gets consecutive strong breakout bars. Again, as I stated yesterday, there is a 50% chance the first move fails on the open.
- Most traders will be better off waiting for 6-12 bars before placing a trade. This is because the market can have big breakouts that fail in the open. If a trader takes one of these breakouts, they have to be quick to make decisions, and it can be easy to get trapped and take a significant loss that is hard to recover before the end of the day. An example was buying bar 1 or bar 5 yesterday. They are good trades, but at yesterday’s high (resistance), traders have to be quick to decide.
- Since the market will gap down, traders should expect sideways on the open and a test of the moving average. It is possible the market goes sideways for the first half of the day, and the market decides on trend reversal or trend resumption in the second half of the day.
- As always, traders should look for a credible stop entry trade on the open, such as a wedge top/bottom or a double top/bottom.
- If a trader takes a breakout trade, they have to be able to assess the probability properly. If they misdiagnose the probability, they could be taking a less than 60% breakout and have a lousy risk-reward. My point in bringing this up is to be careful of breakouts, especially on the open.
- Overall, the bears hope this is the start of the bear breakout below the bull flag on the daily chart. They want a gap down on the U.S. session and a bear trend. The bulls hope any gap down in the U.S. Session will lead to a second entry buy on the daily chart, which would be a bull trend today during the day session.
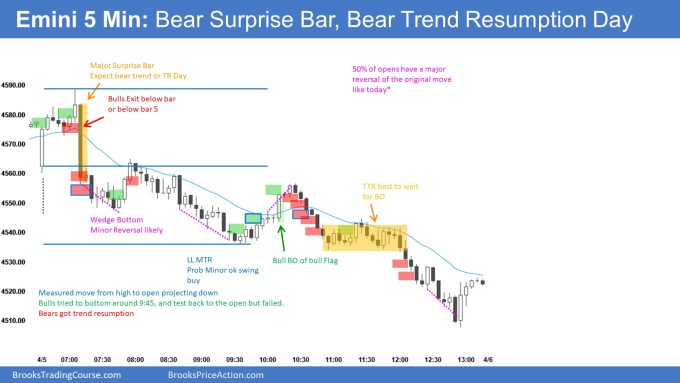
Yesterday’s Emini setups

Emini charts created by Brad. Al will be back on April 11, 2022
EURUSD Forex market trading strategies
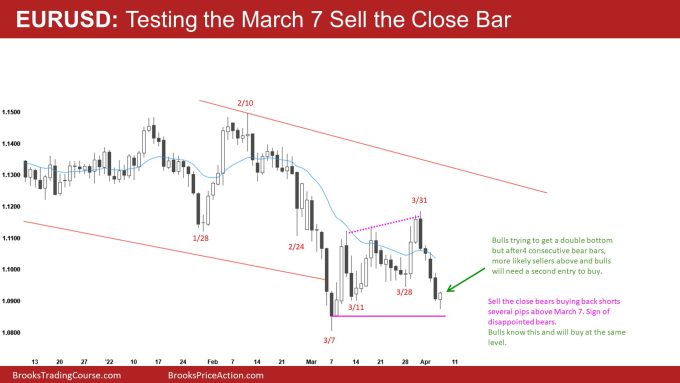
EURUSD Forex daily chart

- The bears now have four consecutive bear bars closing on low, with 3 bars being big. This is a sign of urgency by the bears.
- The odds are the first reversal up will fail and lead to a second leg down.
- As of this moment, the market will probably reach the March 7 Low close and get the March 7 low.
- The bulls will need to develop more buying pressure before getting a credible swing up. At a minimum, the bulls will need a micro double bottom.
- The market is currently sell the close, which means bears will sell closings betting that the first reversal up will fail.
- The market is still within the March trading range and is near the buy zone. While the four consecutive bear bars are too strong for most bulls to buy if the market starts to go sideways, more and more traders will buy (to go long and to exit shorts).
- The bears are hopeful that this selloff leads to a bear breakout of the March range and a test down to the 2020 price levels.
- The bears have a strong case here for getting the bear breakout. However, the market is still in a trading range and may form a bottom which would disappoint traders.
- It will be interesting to see what the March 7 sell the close bears will do here. In theory, some bears sold the March 7 close and were willing to scale in higher. Some bears would add on more below the March 10 bear bar and exit the entire trader at breakeven.
- Other bears may sell more below March 31, and after the four consecutive bear bars, those bears might be willing to press their bets and continue to sell more at the March 7 close. Otherwise, those bears will look to buy back shorts at the March 7 close, which would cause the market to bounce.
- Currently, there are some bulls and bears buying since the market is close to the March 7 close. There is potential for today to close on its high, but the bulls’ problem is that a bull bar will be following four consecutive bear bars.
- The bulls hope that a strong bull close today will lead to a double bottom and measured move up. The bears hope any rally today will be followed by more selling and a weak bull signal bar.
Summary of today’s S&P Emini futures price action and what to expect tomorrow

Emini charts created by Brad. Al will be back on April 11, 2022
End of day summary
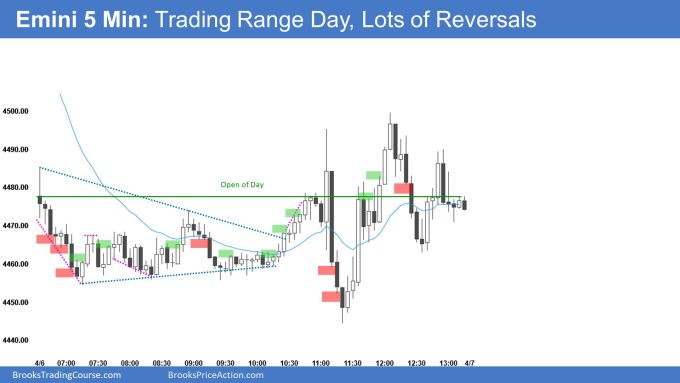
- Today, the market gapped down and formed a parabolic wedge bottom around 7:15 PT.
- When you have a gap down, the odds typically favor sideways to the moving average like it did around 8:30 PT.
- Today was also an FOMC day, which increased the odds of trading range price action today.
- The first FOMC bar was a big bull bar closing around its midpoint. This is a sign of weakness by the bulls and that the market may continue sideways to down.
- Next, the bears broke out to the downside. However, they failed to get a strong bear breakout below the day’s low around 11:15 PT. The bears gave up here, and the market had a two-legged rally to a new high of the day. After that, the market went sideways and closed around the open of the day.
See the weekly update for a discussion of the price action on the weekly chart and for what to expect going into next week.
Trading Room
Traders can see the end of the day bar-by-bar price action report by signing up for free at BrooksPriceAction.com. I talk about the detailed S&P Emini futures price action real-time throughout the day in the BrooksPriceAction.com on trading room days. We offer a 2 day free trial.
Charts use Pacific Time
When I mention time, it is USA Pacific Time. The Emini day session charts begin at 6:30 am PT and end at 1:15 pm PT which is 15 minutes after the NYSE closes. You can read background information on the market reports on the Market Update page.


Brad hey, thanks for the report. Do you think that Wednesday’s daily bar has completed the 2 legs correction from March 29th top as I see nearly identical legs sizing wise. If yes, what would you like to see on the daily chart to conclude the correction by the bears has been completed?