Al added some comments
Market Overview: Weekend Market Analysis
SP500 Emini Breakout Mode with both double top and double bottom flags on the daily chart. There is a 50% chance of a successful bull breakout and a 50% chance of a successful bear breakout.
The EURUSD Forex is in a 2 week tight trading range. Bulls want a reversal higher from a micro wedge bottom from below the yearlong trading range. The bears want resumption and a measured move down from a lower high.
EURUSD Forex market
The EURUSD weekly chart
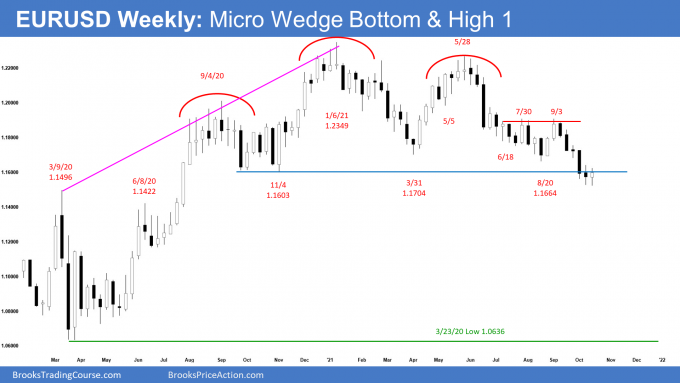
- This week’s candlestick on the weekly EURUSD Forex chart traded below last week’s low but reversed up to close as a bull doji.
- Al has been saying a streak of 6 consecutive bear bars has not happened in 3 years. That made it likely that the weekly chart would have a bull body either this week or next week.
- The bears hope that the small, sideways bars of the past 2 weeks is just a pause in the 7-week bear micro channel.
- They want a 700-pip measured move down, based on the height of the yearlong head and shoulders top.
- They also want a measured move down to 1.1420, based on the height of the July 30/September 3 double top bear flag. That would also be an exact test of the June 8, 2020 breakout point.
- The bulls want the breakout below the yearlong trading range to fail. They also want a reversal up from the wedge bottom created by the March 31 and August 20 lows.
- A small bull body with a tail above following a tight 7-bar bear microchannel is a weak setup for a strong reversal up. A pullback (bounce) from here would likely only be minor.
- Traders are deciding if the selloff will reach targets below before reversing up, or if the reversal up began this week.
- The odds still favor a dip below the March 9, 2020 high within the next few weeks. This is true even if the EURUSD rallies for a couple weeks first.
- The EURUSD has been in a trading range for 6 years. In a trading range, when a pullback gets near support or resistance, it usually goes through it before reversing.
- The August 20 low is the breakout point for the September selloff and therefore a magnet above.
- Consequently, traders should expect a rally for several weeks to at least above the August 20 low and maybe to the September 3 high (July 30/September 2 double top).
- However, it might first fall to 1.14, which is June 10, 2020, high and the measured move down from the double top.
The EURUSD daily chart
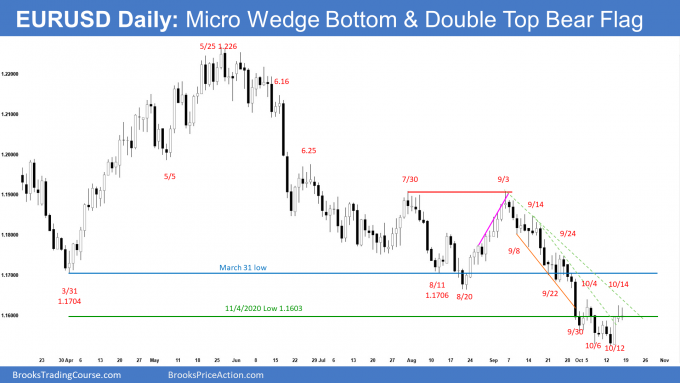
- The EURUSD Forex daily candlestick chart traded below October 6 low on Tuesday and then reversed higher on Wednesday from a micro wedge bottom (September 30/October 6) to test the October 4’s high.
- The bulls hope that this 3rd reversal up from below the yearlong trading range will be successful.
- They want Thursday and Friday to be a pause from Wednesday’s strong reversal up. They then want at least a second leg sideways to up move.
- The Aug 20 low is the breakout point for the September selloff and therefore a magnet above.
- The bears want the 2-week tight trading range to simply be a 2-legged sideways to up pullback from the tight channel down from September 3.
- The tight channel down indicates strong sellers and makes it likely that any pullback (bounce) would only be minor, even if it goes above the August 20 low.
- The bears will sell the lower high for a test of the trend’s extreme and a measured move lower.
- The measured move from the July 30/September 3 double top bear flag is around 1.4.
- If the EURUSD reverses down next week, there would also be a smaller double top bear flag with the October 4 high.
- The daily chart is oversold and almost at important targets below. There should be a reversal up lasting several weeks from around here or from a test of the 1.14 measured move and the June 8, 2020 breakout point. The rally could reach the September 3 lower high.
S&P500 Emini futures
The Monthly Emini chart
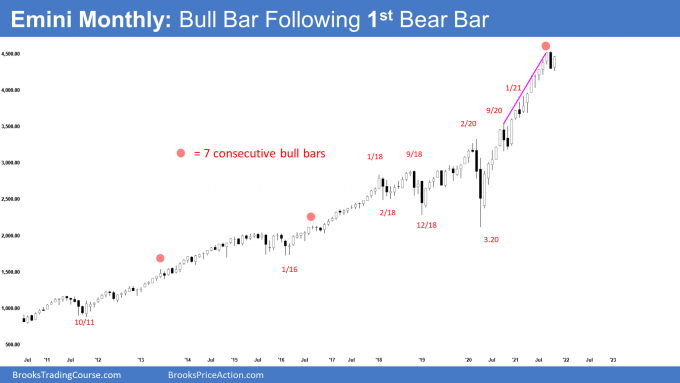
- The candlestick on the monthly Emini chart so far is a bull bar closing near its high.
- If the month remains like this, it will be a High 1 buy signal bar for November. November then would probably trade above the October high.
- September was a big outside down bar. It was the third time there was a bear bar in the rally from the pandemic crash.
- Look at all prior buy climaxes over the past decade. Most of the time, once there was a bear bar, there was another bear bar within a month or two. That should therefore happen this time.
- The month after an outside down bar rarely is an outside up bar. That would create an OO (outside-outside) Breakout Mode Pattern. While unlikely, October could rally strongly to above the September high before the end of the month.
- Either November or December should be a 2nd bear bar.
- The bar after an outside bar often has a lot of overlap with the outside bar. So far, this remains true.
- It is in the middle of the month and the monthly candlestick will look different by the close of the month.
- At the moment, traders should expect sideways to down trading for a couple more months, even if there is a rally to the September high in October or November.
The Weekly S&P500 Emini futures chart
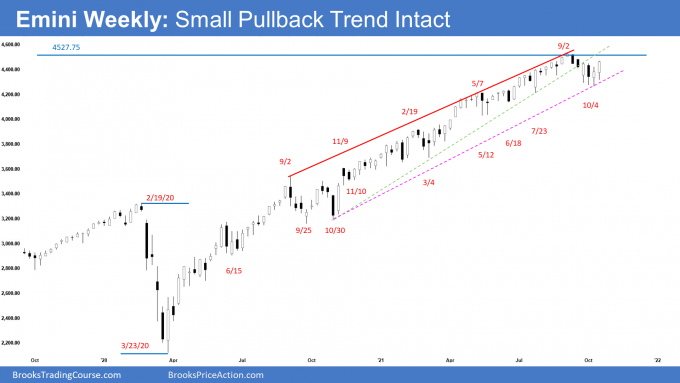
- This week’s Emini candlestick was a bull bar closing near the high with a long tail below. It is reversing higher from a micro wedge bottom.
- Because the week closed near its high in a bull trend, there is an increased chance of higher prices next week. Next week might gap up on the weekly chart.
- This week followed a 6-bar bear microchannel which means persistent selling. The bears want a lower high or a double top with the September 2 all-time high.
- Although the Emini broke below the weekly bull channel in September, the Small Pullback Bull Trend is still intact. There is now a broader bull channel, and the trend line is about parallel with the line at the top of the channel.
- The Small Pullback Bull Trend ends once there is a pullback that is at least 50% bigger than the biggest prior pullback in the trend. That pullback was the 10% pullback in September and October last year.
- Unless next week is a big bull bar, there will still be a 50% chance that September 2 will be the start of that bigger pullback.
- The bulls want a breakout to a new all-time high. The next targets for the bulls are the trend channel line around 4700 and measured move at 4800 based on the height of the July-Sept trading range.
- A 50% chance of September 2 being the high of the year means a 50% chance there will be a new high.
- The bulls know that most reversal attempts in a strong bull trend are minor. That means they become either bull flags or the start of a trading range.
- The Emini has been in a trading range for 4 months. If it reverses down from slightly above the September high, it will still be in the trading range.
- If there is a new all-time high in the next couple of months, it will probably fail to go much above 4,600. Traders should not expect a big leg up until after there has been a 15% correction.
The Daily S&P500 Emini futures chart
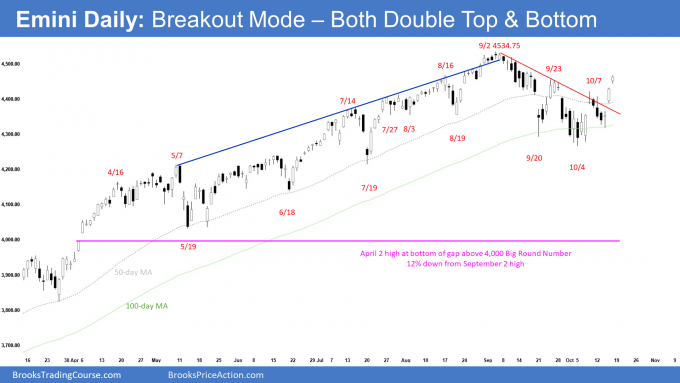
- Emini breakout mode with double top and double bottom.
- Monday was big outside down bear bar and the Emini reversed lower from the 50-day MA and bear trend line.
- The Emini then reversed back higher from a test of the 100-day MA to above the 50-day MA on Thursday and Friday.
- Traders do not know yet if Thursday and Friday’s rally was a buy vacuum test of resistance at the September 23 high or all-time high, or a resumption of the 18-month bull trend.
- Al has been saying that the Emini would probably form a trading range between the 50-day MA and the 100-day MA and that the Emini would rally to at least a little above the 50-day MA within a couple of weeks. The Emini is now far above the 50-day MA. It might now be support.
- If the Emini stalls here for a few days and then turns down, it would form a double top bear flag with September 23 lower high.
- The Emini is in a month-long trading range between September 23 high and October 4 low.
- It is also within a bigger range that began in July.
- As long as the Emini is in the trading range, it is in Breakout Mode. That means there is a 50% chance of a successful bull breakout and a 50% chance of a successful bear breakout. There is also a 50% chance that the 1st break above or below will fail.
- Traders need to see a strong break below the October 4’s low or above the September 23rd lower high before believing that the trading range is converting into a trend.
- A bear breakout would be from a head and shoulders top or a double top.
- A bull breakout would be from a triangle that began on July 19.
Trading Room
Traders can see the end of the day bar-by-bar price action report by signing up for free at BrooksPriceAction.com. I talk about the detailed Emini price action real-time throughout the day in the BrooksPriceAction.com trading room. We offer a 2 day free trial.
Weekly Reports Archive
You can access all weekly reports on the Market Analysis page.


Thanks for the detailed report as always! Since I’m also using Al’s trading language for stocks swing, I’m wondering if 6-8 consecutive bull bars on a monthly chart alongside the notion of climatic move with a bear bar soon to follow applies too?
What about the 4000 gap?
That is more than a 15% correction, which is the target for the bears (based on percent or actual points). It is more important then the gap. I have mentioned the gap many times as an important magnet, and a 15% correction would fall below that Big Round Number and gap.
Thanks for your analysis Andrew.
You’re most welcome George.. and appreciation to Al’s constant guidance..