Market Overview: Weekend Market Analysis
The SP500 Emini futures had a low 1 short two weeks ago on the weekly chart as the Emini bears want selloff below January low. While the bears may get the market to fall below the January low soon, the odds of them getting a successful breakout below are small. The bears do not seem to have urgency to the downside, and traders will likely look to buy around the January lows, or even above the January lows, anticipating that the market will not fall below it.
The bulls understand what the bears are thinking, and they will try and buy aggressively around the January low or slightly above it to prevent a successful bear breakout below the January low. It is important to remember that the market is in a bull trend on the higher time frame, and bull trends constantly look like they are reversing.
The EURUSD Forex market is deciding if the rally in early February is strong enough to lead to an upside breakout that will test the October highs. The bears see the February rally as a failed breakout of a trading range and expect a selloff to the January low and possibly a measured move down. If the bears get the measured move down, they would next want a test of the bottom of the 8-year range. The market is in breakout mode, and while the odds favor the bulls, the bears still have a credible case of the market going lower back down to the January lows.
S&P500 Emini futures
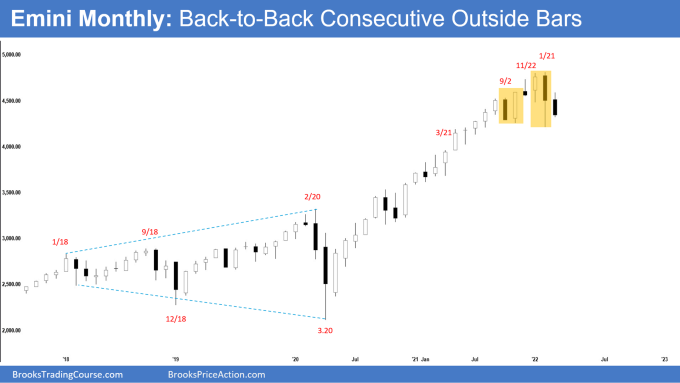
The Monthly Emini chart
Andrew A. created the SP500 Emini and EURUSD charts.
- The candlestick on the monthly Emini chart is a bear inside bar closing on its low. The market has two consecutive OO (Outside – Outside) patterns, the first one back in October.
- An OO pattern is a breakout mode pattern, which means, in general, the odds are close to 50% for both sides. However, currently, the monthly chart has two topping patterns late in a trend following a buy climax which is why Al has been saying the odds favor the market falling below the January low before going above the January high.
- Just because the odds favor the market falling below the January low does not mean that the probability is greater than 60%. As stated above, an OO pattern is a breakout mode, so the odds here are slightly greater than 50%, which means the odds are around 55% to maybe 58%. If the market falls below the January low, the selloff would probably last for 2 to 3 months.
- While the bears are hopeful the market will get a measured move down from the OO pattern or the 7-month trading range, the odds are that any selloff will be brief and will not last much longer than 3 bear bars. Just look at that monthly chart and count the last time the market had 3 consecutive bear bars in a row.
- November 2011 had 5 bear bars in a row and only led to a 24% correction. Even if the market gets 4 or 5 consecutive bear bars, the odds are it will only lead to a pullback in an overall bull trend, even if the pullback is 20% (it would be a bear trend on the daily chart).
- If the bears are lucky, they will get a trading range down to the 4000 round number, which would be a little more than a 15% correction.
- Since the monthly chart is in a small pullback bull trend, the market may pullback 1.5 times more than the largest pullback. September 2020 was the largest pullback, so 1.5 times that would be around 4080, close to a 15% correction.
- Overall, the odds are that any reversal down will lead to a rally back to the all-time high, and the market will begin to go sideways and form a trading range on the monthly chart.
The Weekly S&P500 Emini chart
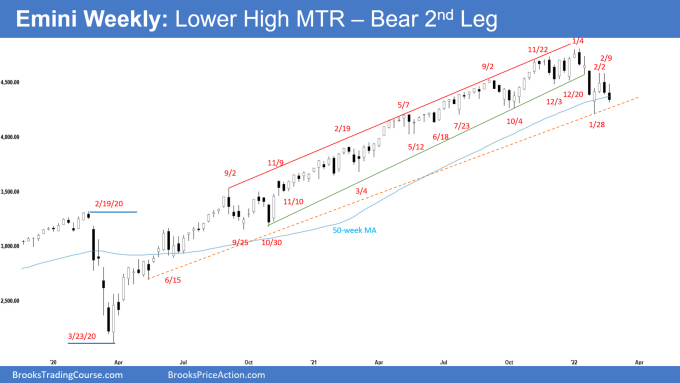
- This week’s Emini candlestick was the entry bar for the stop entry short below last week’s bear bar. However, there is a tail below the bar, and it is within a 7-month trading range and although this is a trend bar, it is a sign of weakness.
- The bears are hopeful that this selloff over the past two weeks will lead to a lower high major trend reversal (head and shoulders top). The bears want next week to be another strong bear bar. If next week is another bear bar, that would be 3 consecutive bear bars which has not happened since September 2020 and would be another sign of strength.
- While this may be the start of a 15-20% correction down to the 4000 big round number, it is important to remember that most major trend reversals are minor reversals and should be thought of as continuation patterns.
- If the market sells off to the January low, it will be a sell vacuum test of the January low and will likely not go far below it.
- While last week may be a lower high major trend reversal, it is likely not enough bars or a retest of the bull highs to become major. That means that any selloff we get here, even if it is a 15% correction, will likely be a part of the trendline break of the bull trend, and after that, the bulls will need a credible test of the bull highs.
- Just ask yourself if you are an investor trading the weekly chart, are you all that worried about the January selloff? Of course not, because you would expect the first correction down to lead to a trading range and have a retest of the highs. It is more likely that the rally over the past 2 weeks is theoretically bulls who bought the high close of the weekly chart, bought more above a bull bar like January 28, and got out breakeven on the entire trade, which usually corresponds to a 50% pullback.
- The point is that even if the market sells off to the 4000 big round number, the bulls will still expect the market to evolve into a trading range, and traders would expect a leg up testing the highs.
- Overall, traders will pay close attention to the bears’ conviction. If the bears are strong, they will get a third consecutive bear bar, which would increase the probability of the bear selloff below the January lows. More likely, the market will remind traders next week of all the trading range price action over the past 6 months, disappoint the bears, and make the market confusing.
- As Al has stated several times if Russia invades Ukraine, that could be the catalyst that leads to a 15% correction down to the 4000 big round number.
The Daily S&P500 Emini chart
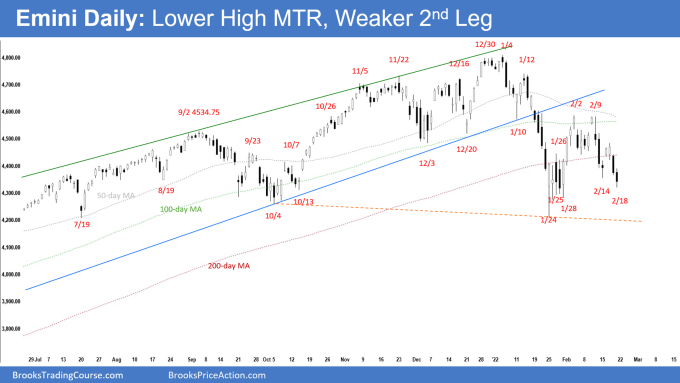
- Friday’s candlestick on the daily Emini chart was a bear bar with a tail below closing slightly below February 14’s low.
- The tail on Friday’s close is disappointing, and the market may lead to a bounce on Tuesday.
- Bears do not want to see Friday close below February 14 and the tail below represents hesitation by the bears, which means the bears are taking profits as the market is going lower instead of selling more below lows such as February 14.
- The bears have sold off to the bottom 1/3 of the trading range (January low to current day).
- While the bears are hopeful for a bear breakout of the January range, the current selloff looks like a bear leg in a trading range. It also appears to be forming a wedge bottom that is the second leg of a double bottom with the January low.
- The bulls are hopeful they can get a strong stop entry buy setup for the wedge bottom early next week, leading to a possible breakout of the February highs and a measured move up to top of January – February trading range.
- As stated above, the odds are the market will not fall far below the January lows due to higher time frames being in a strong bull trend.
EURUSD Forex market
The EURUSD weekly chart
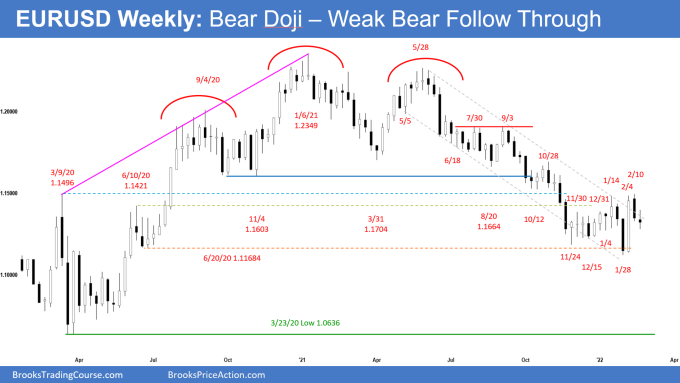
- This week’s candlestick on the weekly EURUSD Forex chart was a weak entry bar for the bear reversal bar that formed two weeks ago.
- The bulls had a strong bull bar following a final flag on February 4; however, they had terrible follow-through on the next bar.
- The bulls are hopeful that the past two weeks have been a breakout pullback and that the market will lead to an upside breakout.
- The bears are hopeful that February 11 is a stop entry short that leads to a measured move down and ultimately a test of the 2020 lows. Next, the bears would want a test of the 8-year bottom of the range.
- If the bears can get a big bear bar closing on its low this week, that would increase the odds of the market reaching the January lows and possibly a measured move down.
- A channel is a leg in a trading range, which means the market will likely test the October and September highs. The market reached the start of the channel from June 2020 (1.1168) and failed to break below it. The same is likely to happen with the channel’s September or October 2021 start. More likely, the market will continue to go sideways.
- The above is one of the reasons Al has been saying he expected a rally for several months after the selloff last year. The odds of the rally up to the October lows are higher because of the possible final flag reversal setup from the January failed bear breakout. Most moves form a channel that eventually gets retested, forming a trading range.
- Lastly, as Al has said, if Europe handles the Russia Ukraine conflict poorly, that could cause a strong bear breakout in the EURUSD.
The EURUSD daily chart
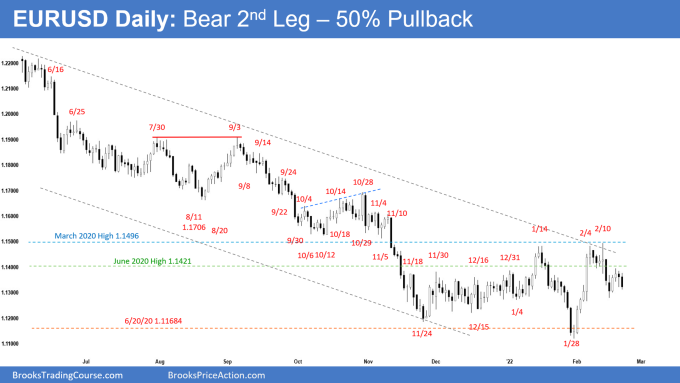
- The candlestick on the daily EURUSD Forex chart was part of a 5-bar tight trading range.
- The bulls tried for a higher low major trend reversal on February 15. However, the bulls failed, and the market continued more sideways.
- The bulls may form a double bottom higher low major trend reversal with the February 15 low.
- The odds still favor a rally that breaks above the February highs and a rally lasting for at least a couple of months (see weekly chart summary for details).
- Following the strong February bull breakout, the market has had a 10-bar pullback. 10 bars lowers the probability for the bulls; however, it is not yet 50%-50%, and the odds still favor more up.
- Since the market is still in a trading range, the market may fall below obvious support before reversing back up, such as the February 3 bottom of the bull breakout.
- Least likely, the market will have an endless pullback that sells off to the low of January.
- If the bulls are lucky next week, they will get a second entry buy setup closing on its high. Traders should be open to a possible failed breakout below the February 14 lows. If the market went below February 14 and reversed up, that would trap weak bulls out who went long on February 15 with a stop below February 14 low. This would stop those bulls out, and also, bears would not be willing to hold short if the market reverses up after falling below February 14.
- More likely, the market is in a trading range, so traders should expect something confusing and disappointing for both the bulls and the bears.
Trading Room
Traders can see the end of the day bar-by-bar price action report by signing up for free at BrooksPriceAction.com. I talk about the detailed Emini price action real-time throughout the day in the BrooksPriceAction.com trading room. We offer a 2 day free trial.
Weekly Reports Archive
You can access all weekly reports on the Market Analysis page.

