Trading Update: Friday January 13, 2023
Emini pre-open market analysis
Emini daily chart
- The market gapped up yesterday right at the 4,000 big round number. However, the day was a doji, which is a trading range bar. This is a sign of the bull momentum decreasing and a sign of trading range price action.
- The bears want reversal down today to form a wedge top with January 3rd and 9th.
- The bears that sold below January 9th are likely disappointed with the past three-day rally. They will be interested in getting out around breakeven if the market drops to the January 9th low. This means that the market will find support back at this price level.
- The bulls still have a chance at getting a bull breakout of a bear flag and getting a measured move up from the December 22nd low to the January 9th high, which projects up to the December 13th high.
- The bulls also have a bear trendline just above around 4,080. The market failed to reach it on December 13th, and the market may have to go sideways to up and test it.
- Although the reversal from the December 22nd low damages the bear selloff that began on December 13th, the bears still have a credible shot at a second leg down. The market is near the sell zone, and some bears will sell, taking a chance that the market gets a second leg down from the five-bar selloff that began on December 13th.
- It is common for breakouts to have deep pullbacks before getting a second leg, so the bears still have an argument here. With the tight rally up from January, the bears may need a micro double top before they can get a credible sell signal.
- Overall, today will likely disappoint the bulls by forming a bear bar, increasing the odds of trading range price action.
Emini 5-minute chart and what to expect today
- The market is down 40 points in the overnight Globex session.
- The Globex market has been selling off in a tight bear channel from 2:30 AM PT.
- The selloff is strong enough to get at least a second leg down likely. This increases the odds that today will close below the open of the day.
- As I often say, the open will likely have a lot of trading range price action, which means traders should expect most breakouts to fail until there is a clear breakout with follow-through. Typically, traders will wait for consecutive trend bars closing above their midpoints with at least one closing on its extreme before they buy the close/sell the close for a second leg.
- Most traders should consider not trading for the first 6-12 bars. This is because most breakouts fail within the first hour, and by bar 6, there is around a 50% chance of the high or low of the day being set.
- Because the odds favor a second leg down, traders pay close attention to any rally on the open from the overnight selloff. If the market does get a rally, it may fail and lead to a second leg down and a reasonable swing trade.
- A swing trader can also wait for a credible stop entry in the form of a double top/bottom or a wedge top/bottom. There is typically an 80% chance of a swing trade within the first two-hour that begins from one of the patterns listed above.
- Today is Friday, so weekly support and resistance are important. The weekly chart has a strong bull trend bar with a small tail above.
- The problem the bulls have on the weekly chart is that the bars are near the midpoint of the December 16th outside down bar, and this price level will likely act as resistance. This means the market may try and sell off today, painting a bigger tail on the weekly chart.
- The overnight Globex selloff has already damaged the bull trend bar on the weekly chart, which means that the battle for the bulls and bears today will be over the midpoint of the week. The bulls want to close above the midpoint, and the bears want to close below it.
- Lastly, since today is Friday, traders must be open to a surprise move late in the final 2 hours. There is an increased risk of a strong move up or down late in the final hours of the week. This means it is important for traders to not be in denial and be sure and trade what they see, not what they hope the market will do.
Emini intraday market update
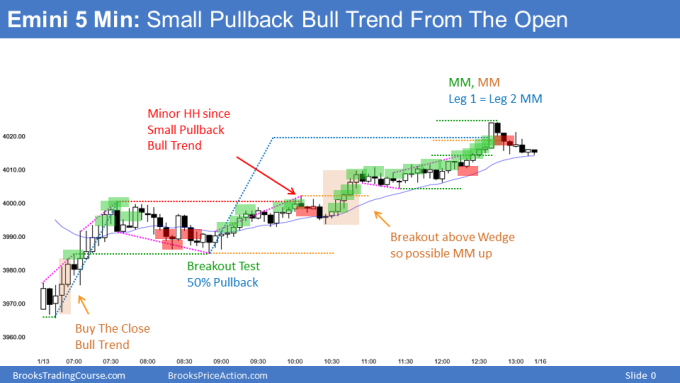
- The Market gapped down on the open and went sideways the first 3 bars.
- As of 7:50 AM PT the bulls are trying to form a trend from the open bull trend.
- While the rally has a lot of overlapping bars, the channel up is very tight.
- The rally up is a small pullback bull trend, which is a breakout on a higher time frame.
- The market has likely seen the low of the day.
- The market may begin to go sideways soon; however, if it does, the downside will likely be limited, at least for the next several bars.
- Bears have been unable to get consecutive bear trend bars, and until the bears can show more signs of strength, any selloff will likely lead to a minor reversal.
- The market may go sideways for several hours and form a breakout mode situation for trend resumption/trend reversal going into the final 1/3rd of the session.
Yesterday’s Emini setups

Al created the SP500 Emini charts.
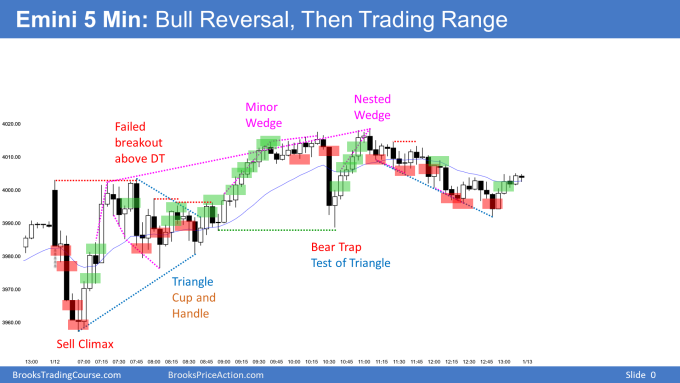
Here are several reasonable stop entry setups from yesterday. I show each buy entry with a green rectangle and each sell entry with a red rectangle. Buyers of both the Brooks Trading Course and Encyclopedia of Chart Patterns have access to a much more detailed explanation of the swing trades for each day (see Online Course/BTC Daily Setups).
My goal with these charts is to present an Always In perspective. If a trader was trying to be Always In or nearly Always In a position all day, and he was not currently in the market, these entries would be logical times for him to enter. These therefore are swing entries.
It is important to understand that most swing setups do not lead to swing trades. As soon as traders are disappointed, many exit. Those who exit prefer to get out with a small profit (scalp), but often have to exit with a small loss.
If the risk is too big for your account, you should wait for trades with less risk or trade an alternative market like the Micro Emini.
EURUSD Forex market trading strategies
EURUSD Forex daily chart

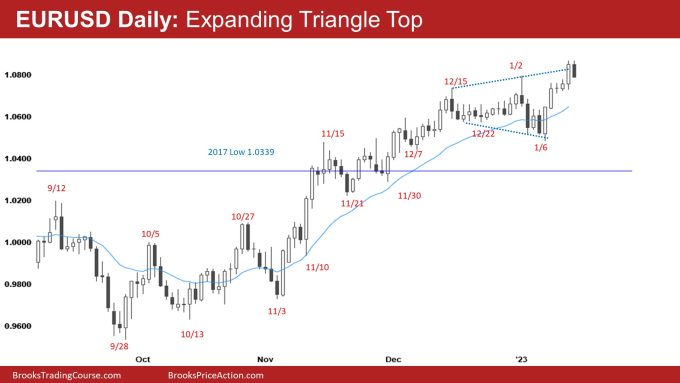
- The EURUSD had a strong bull close yesterday. However, the bar was big, making it a buy climax and increasing sellers’ risk at the bar’s close.
- Also, it was a breakout above the high of January 2nd, which is a profit-taking zone for the bulls. Bears know this, and they will sell above the January 2nd high.
- The bears see the rally as a part of an expanding triangle top. They want the market to reverse back into the trading range and ultimately break below the January 6th low.
- Overall, the daily chart is likely in a trading range, which increases the odds of more sideways than up.
- While the market is in a sell zone, the bears may have to form a micro double top before getting a downside breakout.
- Overall, traders should expect sideways to down over the next several weeks.
Summary of today’s S&P Emini futures price action and what to expect tomorrow

Al created the SP500 Emini charts.
End of day review
- I will update at the end of the day.
See the weekly update for a discussion of the price action on the weekly chart and for what to expect going into next week.
Trading Room
Al Brooks and other presenters talk about the detailed Emini price action real-time each day in the BrooksPriceAction.com trading room. We offer a 2 day free trial.
Charts use Pacific Time
When times are mentioned, it is USA Pacific Time. The Emini day session charts begin at 6:30 am PT and end at 1:15 pm PT which is 15 minutes after the NYSE closes. You can read background information on the market reports on the Market Update page.


thanks Brad for the work! I just also like to say your intraday notes helped me check my analysis is in the right direction, especially when PL is down.
Hi KL,
Glad to hear they are helpful!
Hi, you mentioned that there was a bear trend line just above 4080 on the emini chart, and that it wasn’t tested on 12/13/22. Can you tell me which days you connected to draw that line? The only bear trend line I see which wasn’t tested by 12/13/22 is the one from 1/4/22 to 3/29/22. It is about 4150 on 1/13/23.
Appreciate the help.
Hi Nixon,
That is the same Trendline I have as well, so you are right in your thinking.
It will be interesting to see if the market has to reach it over the next couple of weeks.