Trading Update: Thursday March 9, 2023
Emini pre-open market analysis
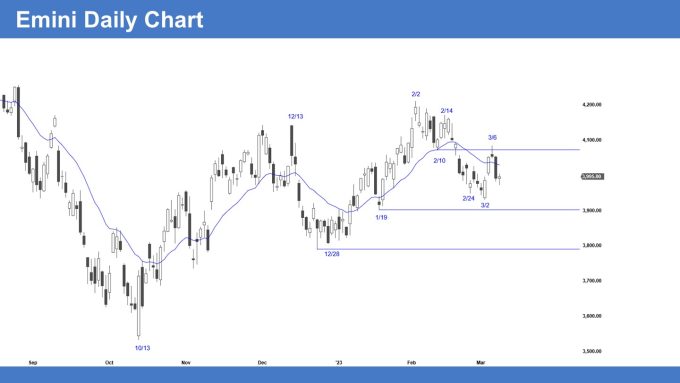
Emini daily chart

- Tuesday was a big bear breakout and a strong enough of a surprise to get a 2nd leg down, probably. Yesterday is an Emini bad High 1 buy, however there are probably sellers above.
- Yesterday, we sold off to the March 1st bad buy signal bar high and reversed up. There were likely sellers above March 1st willing to scale in higher.
- These bears were disappointed by the two-bar breakout on March 2nd and 3rd. Those bears were likely more than happy to exit back at their original entry, March 1st.
- Since there were trapped bears around the March 1st high, the downside is probably limited. If bears sold the high and suffered a big drawdown, they will be cautious about selling at that same price level. The market has memory, which is why double bottoms and double tops are so common.
- Some bulls bought below March 6th expecting a 2nd leg up after the March 3rd two-bar breakout.
- Instead, those bulls got trapped and suffered a 64% pullback. This is enough for the bulls to be disappointed and wants to exit the trade back at the March 6th low.
- This means that there is resistance around the midpoint of Tuesday’s bear bar and the March 6th low.
- Some bulls will be happy to exit their losing trade around breakeven. This increases the odds of the bears getting at least a small 2nd leg down after Tuesday’s bear bar before the bulls return to the March 6th low.
- The market is in a trading range. This means that both bulls and bears who use wide stops and scale-in will probably make money.
- Today is a High 1 buy following a big bear breakout (March 7th). This means there are probably sellers above yesterday’s high, betting on at least a small 2nd leg down. In general, High 1/Low1 setups are good stop entries in strong breakout. They are bad stop entries in trading ranges.
Emini 5-minute chart and what to expect today
- Emini is up 8 points in the overnight Globex session.
- The Globex market had two large legs during the overnight session on the 15-minute chart.
- The market rallied back to the midpoint of yesterday’s day session range before the 5:30am PT unemployment claims report. After report the market rallied over 20 points up.
- As I often say, traders should expect a lot of sideways limit order trading on the open. This means that most traders should wait for at least 6-12 bars before placing a trade.
- Most traders should look for a swing trade on the open because it proves a strong risk/reward (more than two times the risk) and usually has a decent probability.
- There is often a swing trade beginning before the end of the 2nd hour that forms after the formation of a double top/bottom or a wedge top/bottom.
- The swing trade on the open often forms after a credible stop entry following one of the patterns mentioned above, and it usually has at least a 40% of the market moving half of the average daily range.
- Since yesterday is a bad High 1 buy signal bar (see daily chart discussion above), there are probably sellers above. This means today has an increased risk of forming an early high of the day and going outside down below yesterday.
- The single most important thing on the open is to be patient. As Al Brooks says, “a trade is never overdue.”
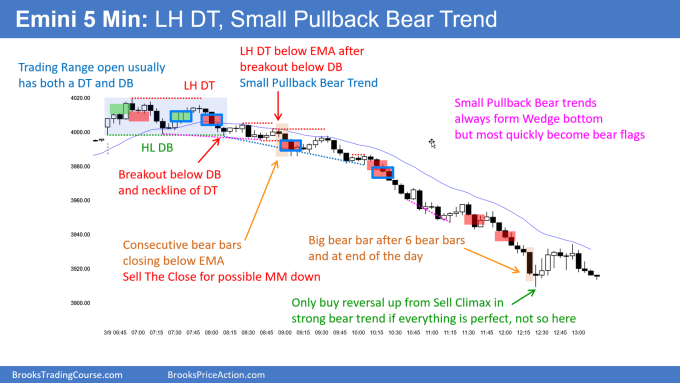
Emini intraday market update
- The Emini gapped up and rallied for the first four bars of the day.
- The bears formed a low 2 short with bar 5; however, bar four was a big enough bar that the odds favored more sideways and not a bear trend.
- The first 12 bars had a lot of sideways trading, which increased the odds of more trading range price action.
- I am writing this as of bar 30 (9:00 AM PT), and the bears are trying to get a downside breakout below the opening range. The bears want the day to become an outside down day on the daily chart.
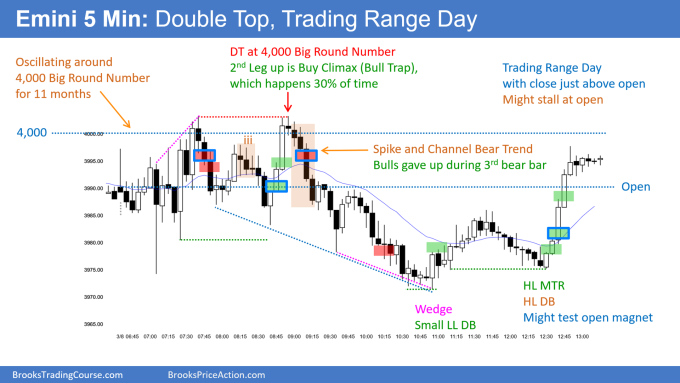
Yesterday’s Emini setups

Al created the SP500 Emini charts.
Here are several reasonable stop entry setups from yesterday. I show each buy entry with a green rectangle and each sell entry with a red rectangle. Buyers of both the Brooks Trading Course and Encyclopedia of Chart Patterns have access to a near 4-year library of more detailed explanations of swing trade setups (see Online Course/BTC Daily Setups). Encyclopedia members get current detailed setups.
My goal with these charts is to present an Always In perspective. If a trader was trying to be Always In or nearly Always In a position all day, and he was not currently in the market, these entries would be logical times for him to enter. These therefore are swing entries.
It is important to understand that most swing setups do not lead to swing trades. As soon as traders are disappointed, many exit. Those who exit prefer to get out with a small profit (scalp), but often have to exit with a small loss.
If the risk is too big for your account, you should wait for trades with less risk or trade an alternative market like the Micro Emini.
EURUSD Forex market trading strategies
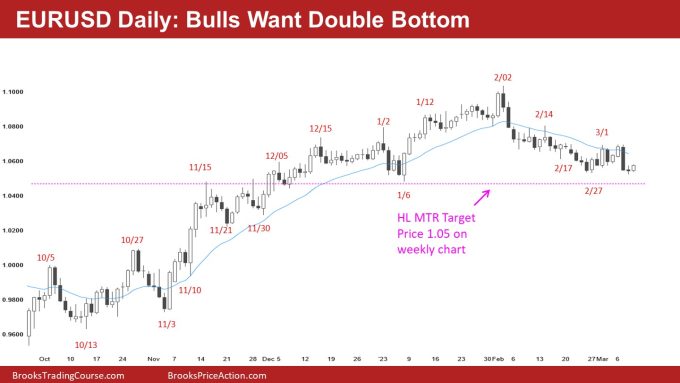
EURUSD Forex daily chart

- The EURUSD got a big downside breakout on Tuesday following a wedge top.
- As expected, the follow-through after Tuesday’s bear breakout was bad. This is a reminder that Tuesday’s breakout is likely a breakout within a trading range that will lead to disappointment and sideways trading.
- Remember, Al says that 90% of breakouts are part of a trading range/channel, which means they often get a 2nd or 3rd leg and reverse.
- There are trapped bulls who bought during Tuesday’s selloff and got trapped by this breakout bar. The market is deciding how eager those trapped bulls are to exit.
- If the bulls rush to exit, they will look to sell above yesterday’s high, and the market will get a 2nd leg down. If today does not pullback much and continues to get bigger, more and more bulls may decide that the downside is limited, and some will buy more below yesterday.
- The bears want today to lead to a failed breakout of yesterday’s high and reverse, going outside down with yesterday’s bar. The problem with that is even if yesterday goes outside down, closing on its low; traders will probably look to buy below yesterday as well.
- At the moment, the odds are Tuesday is a big enough bear breakout to get at least a small 2nd leg down. However, since the market is in a trading range, traders have to wonder about the possibility that Tuesday is a bear trap.
- One scenario is that the market forms a micro double bottom and get an upside breakout of the neckline (March 7th). If the breakout above the neckline is strong, the market might get a measured move of the past nine days, projecting up to around 1.0843.
Summary of today’s S&P Emini futures price action and what to expect tomorrow

Al created the SP500 Emini charts.
End of day review
- Live stream video trial replacement of end of day review coming soon.
See the weekly update for a discussion of the price action on the weekly chart and for what to expect going into next week.
Trading Room
Al Brooks and other presenters talk about the detailed Emini price action real-time each day in the BrooksPriceAction.com trading room days. We offer a 2 day free trial.
Charts use Pacific Time
When times are mentioned, it is USA Pacific Time. The Emini day session charts begin at 6:30 am PT and end at 1:15 pm PT which is 15 minutes after the NYSE closes. You can read background information on the market reports on the Market Update page.

