- Market Overview: Weekend Market Analysis
- 30-year Treasury Bond futures
- EURUSD Forex market
- S&P500 Emini futures
- The Monthly Emini chart has small parabolic wedge top, but has been sideways for 4 months
- The Weekly S&P500 Emini futures chart has 3 consecutive bear bars, but in trading range with higher lows
- The Daily S&P500 Emini futures chart should go lower after 3 consecutive big bear bars, despite a wedge bull flag
Market Overview: Weekend Market Analysis
The SP500 Emini futures had 3 consecutive big bear bars (days) this week. However, the week also formed a wedge bull flag on Friday. The odds are still slightly greater for a bear breakout and a 10% correction, but a pair of consecutive big bull bars next week will make traders look for a break above 4,000.
Bond futures have been accelerating down in a parabolic wedge sell climax. Since they are in a support zone, they can bounce at any time. Sell rallies. They are in a bear trend.
The EURUSD Forex market has been reversing down on the weekly chart from a 10-month wedge rally. They will probably continue down to the November low at 1.16. However, a strong reversal up next week will create a wedge bull flag. Traders will then wonder if the EURUSD will continue up to the February 2018 high, instead of the January low.
30-year Treasury Bond futures
Bond futures on weekly chart are in sell climax, but in support zone so could bounce at any time
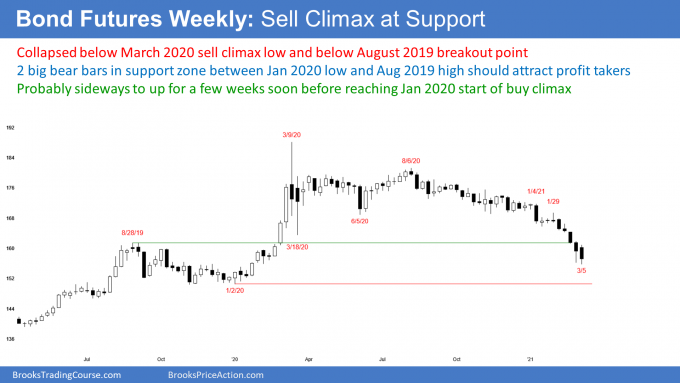
Bond futures have been in a parabolic wedge sell climax on the weekly chart since the August high. I have been saying that they would fall below the March 18, 2020 sell climax low, and below the February 20, 2020 buy climax low, which they did last week.
The bond market formed a big bear bar this week, and it broke slightly below last week’s low. The bears hope next week trades below this week’s low. They want the selloff to continue down to that magnet at the January 2020 low. That was the start of last year’s buy climax, and it is a reliable magnet once there is a reversal down.
Bonds will get there, and ultimately much lower, but they might go sideways to up for a couple months first. I keep saying that bonds will be lower in 5 and 10 years from now. Interest rates are going up.
The ranges last week and this week were big. A big bar late in a sell climax at support usually attracts profit takers. The tails on last week’s low, and this week’s low were created by bears taking windfall profits (short covering).
Will bonds go up in March? There is no evidence for that yet on the weekly chart, although there is now a lower low double bottom on the daily chart (not shown), and a possible micro double bottom on the weekly chart as a result.
But even if the bonds reverse up, the reversal will be minor. Traders will sell it, expecting the bear trend to continue down to the January 2020 low.
EURUSD Forex market
The EURUSD on the weekly chart is working lower after a 10-month wedge top
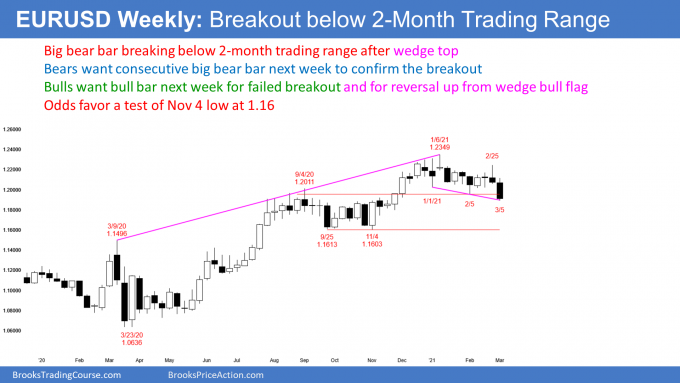
The EURUSD weekly chart has been sideways to down since the January 6 wedge top. Traders are deciding if the wedge will lead to a test of the November 4 low at 1.16.
The alternative is that the selloff is forming a wedge bull flag, and the bull trend will resume up to the 2018 high at 1.2555. If the bulls get a a few big bull bars next week, traders will start to bet on a breakout above the January high. At the moment, it is more likely that the EURUSD will work down to 1.16.
Last week was a sell signal bar. When this week went below last week’s low, it triggered the sell signal. This week was a bear bar, which is good for the bears.
Also, it closed below the February 5 low, which is the bottom of the 2-month trading range. That increases the chance of a measured move down to the November 4 low. The bears need a couple closes on the daily chart (not shown) below the February 5 low, to convince traders that the EURUSD is heading for 1.16.
What about the bulls? Everyone on TV keeps saying that the EURUSD is going higher. While that might be true, it does not mean it will happen next week. It could easily fall to 1.16 before trying again to break above the 6-year trading range at 1.2555.
S&P500 Emini futures
The Monthly Emini chart has small parabolic wedge top, but has been sideways for 4 months
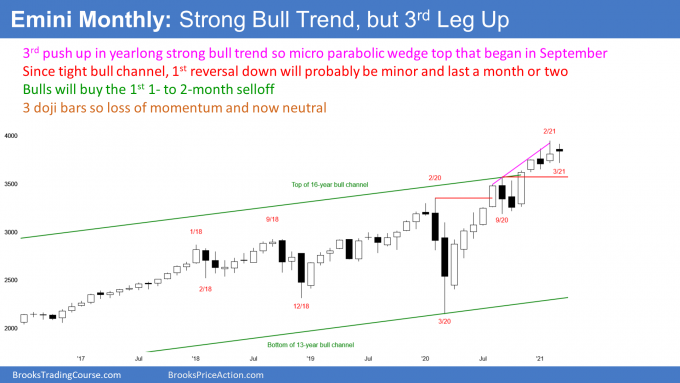
The monthly S&P500 Emini futures chart has been in a strong bull trend since last year’s pandemic low. But the rally has had 3 small legs up, and it is therefore a parabolic wedge. This month so far is a bear bar doji. If it closes near its low, it will be a sell signal bar for the parabolic wedge top. If it closes near its high, traders will look for 4,000 in April.
The wedge began with the September low. It therefore only has 7 bars. If there is a reversal down, traders should not expect TBTL (Ten Bars, Two Legs) on this time frame. That could happen on the weekly chart. That would be a couple legs sideways to down over a couple months on the weekly chart. A couple months means two bars on the monthly chart. Therefore, if February is a top, the reversal down will probably be minor on the monthly chart.
When the Emini broke above the February 2020 high, it pulled back below that breakout point a couple months later. In November, the Emini broke above the September high of 3,568.50, but has not yet tested it. Trends tend to become weaker as they age. Therefore, with the September rally reversing down to below its breakout point, traders should expect a pullback to below the September high, which is a breakout point, within the next few months.
A reversal down often tests the bottom of the most recent buy climax. That is the September low at 3189.75, or about 3,200. If the Emini were to get there, the correction would be about 20%. At the moment, the bears have a 30% chance.
Can the Emini continue straight up to above the 4,000 Big Round Number? The bull trend has been very strong and there are many several weeks left to March. But, the consecutive big bear bars on the daily chart (see below) make it more likely that a 10% correction is underway.
The Weekly S&P500 Emini futures chart has 3 consecutive bear bars, but in trading range with higher lows
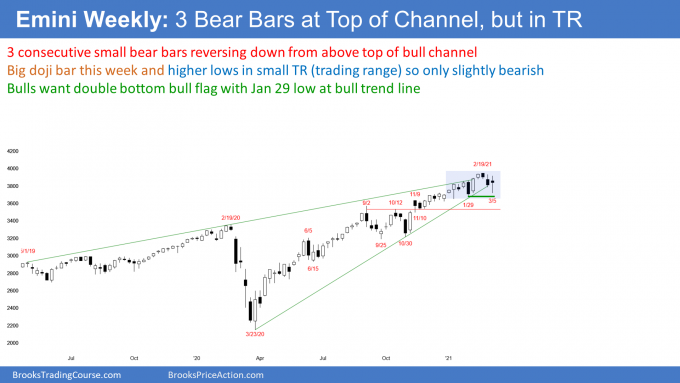
The weekly S&P500 Emini futures chart formed its 3rd consecutive bear bar this week. The last time this happened was during the 10% corrections in September and in October. Also, the Emini this week broke below the bull trend line from the pandemic low.
The selloff has been strong enough for traders to expect at least a 2nd leg sideways to down, after the 1st one or two week bounce. The 1st downside target is the September 9 high. That was the most recent breakout point. It is also near the November 10 low, which was the start of a 3-month bull channel. When a bull channel reverses, it often tests down to where the channel began.
Because the yearlong bull trend has been strong, the bulls have a 40% chance of resuming the bull trend, before there is a 2nd leg sideways to down. If the bulls get a bull bar next week, the weekly chart would become neutral again. Consecutive strong bull bars would make the weekly chart bullish again.
The Daily S&P500 Emini futures chart should go lower after 3 consecutive big bear bars, despite a wedge bull flag
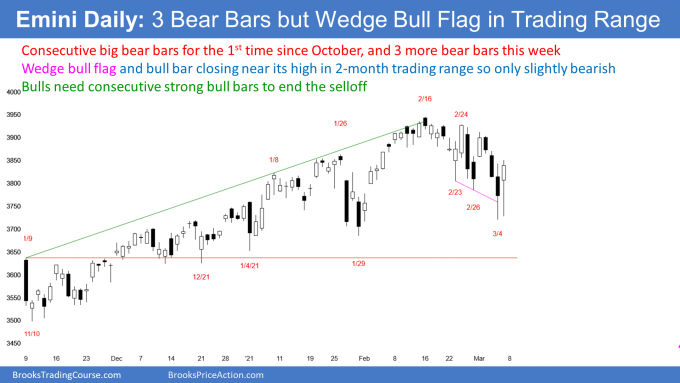
The daily S&P500 Emini futures chart had consecutive big bear bars 2 weeks ago, for the 1st time since the 10% corrections in September, and in October. There were 3 consecutive big bear bars this week.
I wrote last week that there was a 60% chance of a couple legs down and a 10% correction. But with the big tail below this week’s bar, and the higher lows since November 10, the probability is no longer 60%, but it is still better than 50%.
The bears have accomplished several things. The Emini broke below the bull trend line from the October low. Also, it closed the February 2 gap on the daily chart. Additionally, it had 2 consecutive big bear bars 2 weeks ago, and 3 consecutive big bear bars this week. They now need to prevent a big bull bar next week for traders to give up on a 10% correction in March. Otherwise, the chart would be neutral to bullish.
Wedge bull flag
The Emini has had 3 pushes down, and 3 reversals up over the past few weeks. Since the Emini is in a bull trend, this is a wedge bull flag. Because this week closed above its midpoint, it is a reversal bar and a buy signal bar for next week. However, it has a bear body and the prior 2 weeks were bear bars. This is a weak buy setup. There might be more sellers than buyers above its high.
What happens if next week rallies for a couple days and forms a small lower high, and then reverses down below this week’s low? For example, when there is a wedge bull flag, the rally sometimes reverses down from a double top, with either of the 1st 2 legs up. Here, those are the the February 24 and March 1 highs.
The stop for the wedge bottom bulls is below the wedge bottom, which is Thursday’s low. If the Emini falls below the wedge, many bulls will give up. Other bulls will buy, betting on a failed breakout. An unknown number of bears will sell as well.
One of my general rules is that if a market falls below a wedge or any protective stop, there is a 50% chance that the breakout will fail and the market will reverse up, and a 50% chance that the breakout will lead to a selloff and a measured move down. The percentages can be a little higher or lower, depending on the context (bars to the left) and the bars in the wedge, but this is a useful way to look at wedge buy signals.
I bring this up because there is a wedge bull flag, but the past 3 bars had bears bodies. Therefore, this is a lower probability buy setup. If it triggers, it is good to have an idea of what will happen it the buy fails, and there is a downside breakout.
What about next week?
Whenever a market is unable to get a sustained move up or down, it is in a trading range. The Emini has been in a trading range all year. Traders are buying low, selling high, and taking quick profits. This will continue until there is a strong breakout up or down, and there is follow-through. Until then, traders will continue to look for reversals every few days.
As I said, because of the 3 big consecutive bear bars this week, and the 2 big bear bars 2 weeks ago, the odds of a bear breakout are slightly better. But the bulls only need consecutive strong bull bars to make traders expect a break above 4,000.
Trading Room
Traders can see the end of the day bar-by-bar price action report by signing up for free at BrooksPriceAction.com. I talk about the detailed Emini price action real-time throughout the day in the BrooksPriceAction.com trading room. We offer a 2 day free trial.
Charts use Pacific Standard Time
When I mention time, it is USA Pacific Standard Time (the Emini day session opens at 6:30 am PST, and closes at 1:15 pm PST). You can read background information on the intraday market reports on the Market Update page.

