Monthly S&P500 Emini futures candlestick chart:
Strong bull breakout before the December FOMC Fed interest rate hike
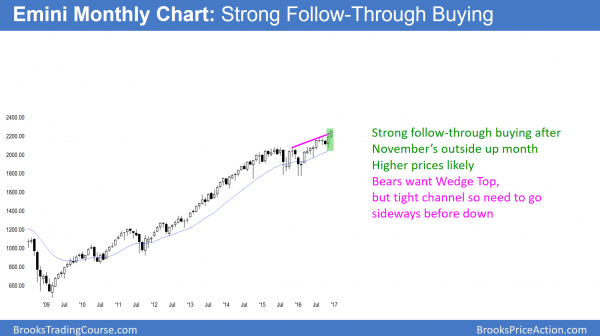
The monthly S&P500 Emini futures candlestick chart has a bull trend bar this month. This is therefore good follow-through buying after last month’s big outside up bar.
The monthly S&P500 Emini futures candlestick chart closed at a new all-time monthly high close in November. This month is currently a bull bar that is trading at the high. This is good follow-through buying. If the month closes near its high, it would therefore increase the chances of higher prices in January.
While there are 3 pushes up this year, they are in a tight bull channel. In addition, the pullback from the 2nd rally was deep. This therefore makes a parabolic wedge top unlikely. In addition, the tight bull channel makes any reversal down likely to be minor. As a result, the bears will probably need at least a micro double top before they can create a reversal. Less likely, the can begin a reversal with a big bear bar or a series of bear bars. The odds favor higher prices.
Weekly S&P500 Emini futures candlestick chart:
Strong bull breakout to a new all-time high
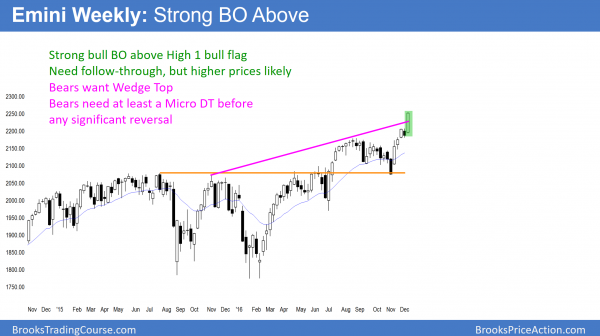
The weekly S&P500 Emini futures candlestick chart formed a big bull trend bar this week.
The weekly S&P500 Emini futures candlestick chart is breaking strongly to a new high. Because last week was a bear bar, the odds were that this week would not be a big bull week. Yet it was. Hence, the odds are that the Emini will go higher.
Whenever a market does something that is unlikely, it traps traders. Bulls get trapped out because they wanted to buy a pullback and therefore did not buy the breakout. Bears expected sellers above last week and sold. Hence, they are trapped in a losing trade. Both bulls and bears will use any pullback to buy. As a result, there will probably be at least one more small leg up after the next reversal attempt.
Never assume that low probability events have no probability. While it is unlikely that next week will be a big bear bar and reverse this week’s rally, there is a 30% chance that it will. Therefore traders have to be willing to sell if a clear, strong reversal develops.
Daily S&P500 Emini futures candlestick chart:
Strong bull breakout and good follow-through buying.
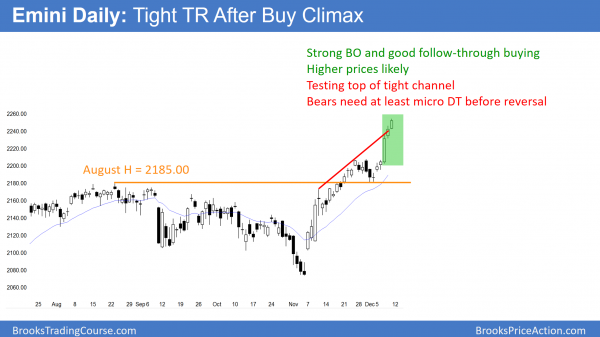
The daily S&P500 Emini futures candlestick chart broke strongly to a new all-time high on Wednesday. In addition, Thursday was a bull bar that closed near its high. That follow-through buying therefore increased the odds of higher prices over the next week or two.
Thursday and Friday have smaller bodies. Hence, the breakout is weakening. This therefore increases the chances of at least a small pullback next week. Furthermore, Wednesday is an FOMC meeting. The Emini will probably go sideways into the report.
The daily S&P500 Emini futures candlestick chart broke strongly to a new all-time high this week. Furthermore, there was good follow-through buying. As a result, even if there is a pullback this week, the odds are that the Emini will go higher for at least the next week or two.
Wednesday’s FOMC meeting and probable interest rate hike
Because there is a 90% chance of a Fed interest rate hike, the raise in rates will not surprise traders. Yet, if the Fed says that it plans many more increases in 2017, that would be a surprise. Therefore there is a potential of a big move down immediately after the report.
Traders are expecting a big move on Wednesday. There is a 50% chance that it will be up. In addition, there is a 50% chance it will be down. Since the Emini will be in Breakout Mode, there is also a 50% chance that the 1st breakout will reverse.
As always, traders will respect the bear case. Wednesday’s FOMC meeting is especially relevant. It is a catalyst that can lead to a big move up or down. Yet, because the bull breakout was so strong, the odds are that a bear reversal will probably be minor. That means that it would more likely become a bull flag than the start of a bear trend.
Traders can see the end of the day bar-by-bar price action report by signing up for free at BrooksPriceAction.com. I talk about the detailed Emini price action real-time throughout the day in the BrooksPriceAction.com trading room. We offer a 2 day free trial.
When I mention time, it is USA Pacific Standard Time (the Emini day session opens at 6:30 am PST, and closes at 1:15 pm PST). You can read background information on the intraday market reports on the Intraday Market Update page.


Hi Al,
I find it remarkable noticing so many low probability events unfolding this year. If you look at the weekly chart and see all these solid bear bars closing on their lows, wouldn’t you have expected follow through? For example, on 6/24, 9/9, 11/4 there was selling into the close of the bars, just to be reversed on the very next bar. Also, on the daily chart starting on 10/27 we count seven bear bars, followed by an almost perfect V-shaped reversal. Okay, it was a bear climax, but why this sudden, relentless buying? Are these the Albatross events with multiple legs and wings you joked about a year ago?
I also want to congratulate you on your recent very nice talk at Big Mike’s. I particularly liked your response to the questions posed in the preamble – for years I had wondered about your reply. I have listened to so much incredible BS from your fellow traders on the internet, that your answers strike me at least as honest.
The market has been in a trading range for 2 years. The probability of the breakout up or down is usually about 50% while in a range. As you can see, there were many breakout attempts up and down, and most were very strong. Yet, 80% of attempts fail. What appears to be high probability is much less than it appears when the market is still in a range. It is easy to only see the current leg in a range and minimize the bars to the left. Yet, markets have inertia and tend to continue what they’ve been doing.
When there is a strong breakout, like this one, the probability of higher prices is 60 – 70%. That does not mean 100%. Therefore, as likely as at least 2 legs up are, there is at least a 30% chance that the market will suddenly reverse down without a 2nd leg up.
Hello Al,
You must be wide eyed watching markets events unfold I have not live through such climactic then climactic price action. Brexit / Trump, this is historical Trump especially.
I read that bull markets don’t end on optimisn they end in euphoria, is that what we are seeing and leading up to ? Price action will tell all but there are NO short signals or setups right now.
I totally agree that “it would more likely become a bull flag than the start of a bear trend”. It seems that equity markets have been in the perfect bull conditons since 2009 low interest rates and stimulus or helicopter money as some refer.
It will be very interesting to find out what next catalyst will change all that.
When interest rates get high enough, the stock market will get repriced. Because the market always probes too far before knowing what far enough is, the reversal is often very big. As for most tops coming from euphoria, I think that is overplayed in the media. Look back at the tops on the monthly chart over the past 100 years. Only a few of the 20%+ reversals came abruptly from buy climaxes. Most have a period of indecision before reversing. While it is possible for any strong breakout to soon fail, the bigger the breakout and the stronger the follow-through, the more likely there will be at least one more leg up. This breakout is very strong.
Thanks