Market Overview: DAX 40 Futures
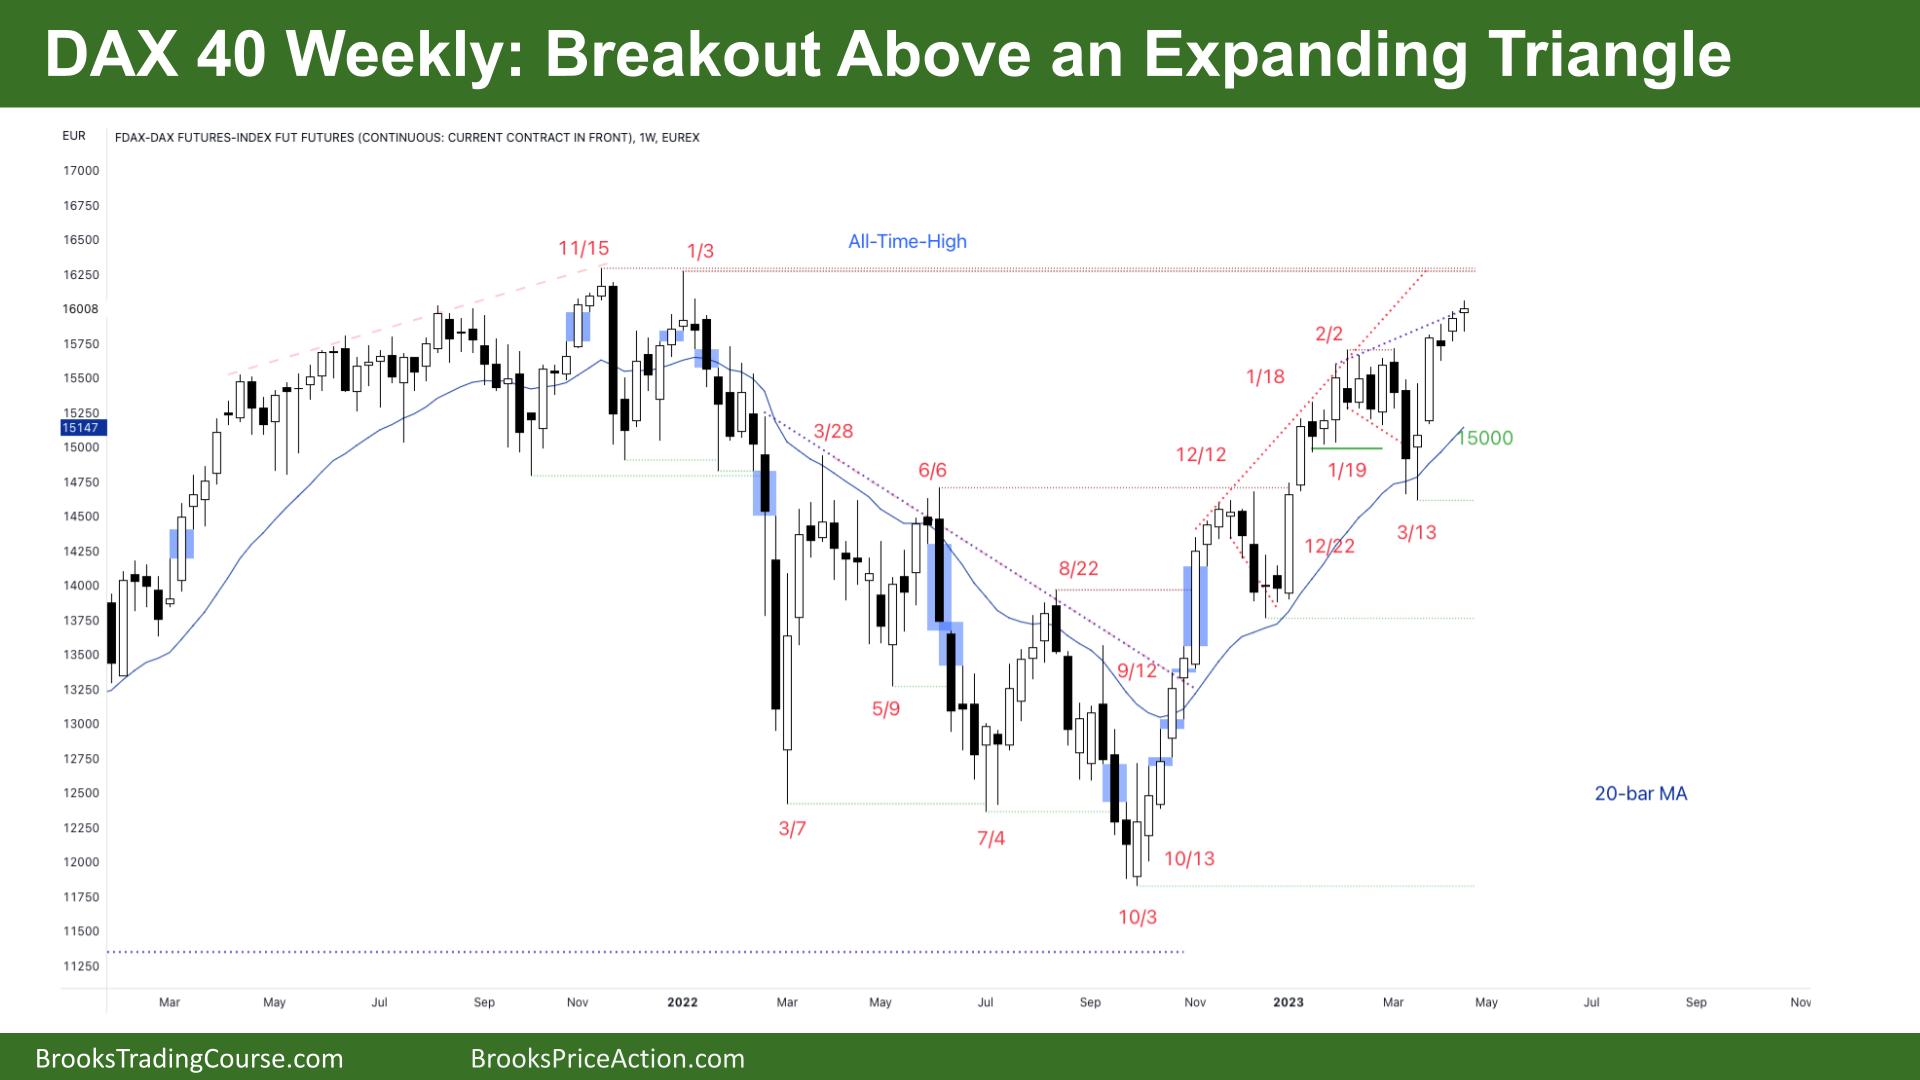
DAX futures moved higher last week with a small doji. The bull breakout above expanding triangle is weak, but the small pullback bull trend is strong. We may need to get to the all-time high before bears get a decent sell signal. The bull channel line is far above, so we might break out here if the bears can’t get a move back to the top of the sell climax.
DAX 40 Futures
The Weekly DAX chart

- The DAX 40 futures on the weekly chart was a small bull doji with big tails above and below.
- It had an open gap at the start of the week, which was closed on Thursday.
- For the bulls, it’s a five-bar bull micro channel, but the bars are overlapping, so it is becoming weaker.
- The first bar to trade below the low of a prior week’s bar is a reasonable buy signal.
- The bulls see a tight bull channel with three pushes up, a possible expanding triangle, and we are breaking above. Expanding triangles in trends often become continuation patterns.
- The bears saw a final flag in February, but we broke above it with follow-through.
- Even if the price pulls back – maybe to the sell climax high on March 13th, bulls want to move up to the all-time high at 16300.
- The bears see the top of an expanding triangle, a third push up and we’re at the top of a trading range.
- It was a reasonable sell above March 6th, a sell climax high, but bulls got a breakout. When a low-probability event happens, the market usually lets traders out, breakeven.
- So if the bears get a bear bar, we will probably get back to the entry bar, with an 80% chance of getting to the midpoint.
- Even with the deep pullback, there are no bear bars for sell signals, so most traders should be looking to buy or waiting until we move back to the moving average.
- Price has been above the moving average since October last year, six months, so if we do get back to the moving average, now at 15000, we’re more likely to find buyers there.
- Traders have been happy to pay above-average prices, so they’ll take the opportunity to scale in there.
- Some traders will see a small pullback bull trend on the weekly chart because of the two open gaps – November and the body gap above December.
- The spike from October to December 2022 created a channel at 14000, and until we take out a major swing low, the price will continue to trend higher.
- The bears have a big distance to get to that swing point. They might also give up and look to sell at the all-time high.
- Bulls have transitioned from buying above bars to buying pullbacks and buying below, and now with three consecutive dojis, traders expect price to pull back in the next couple of weeks.
- Currently, we’re always in long. So traders should be long or flat. If you’re long you can get out below a bear bar closing below its midpoint, or a scalp below any bar.
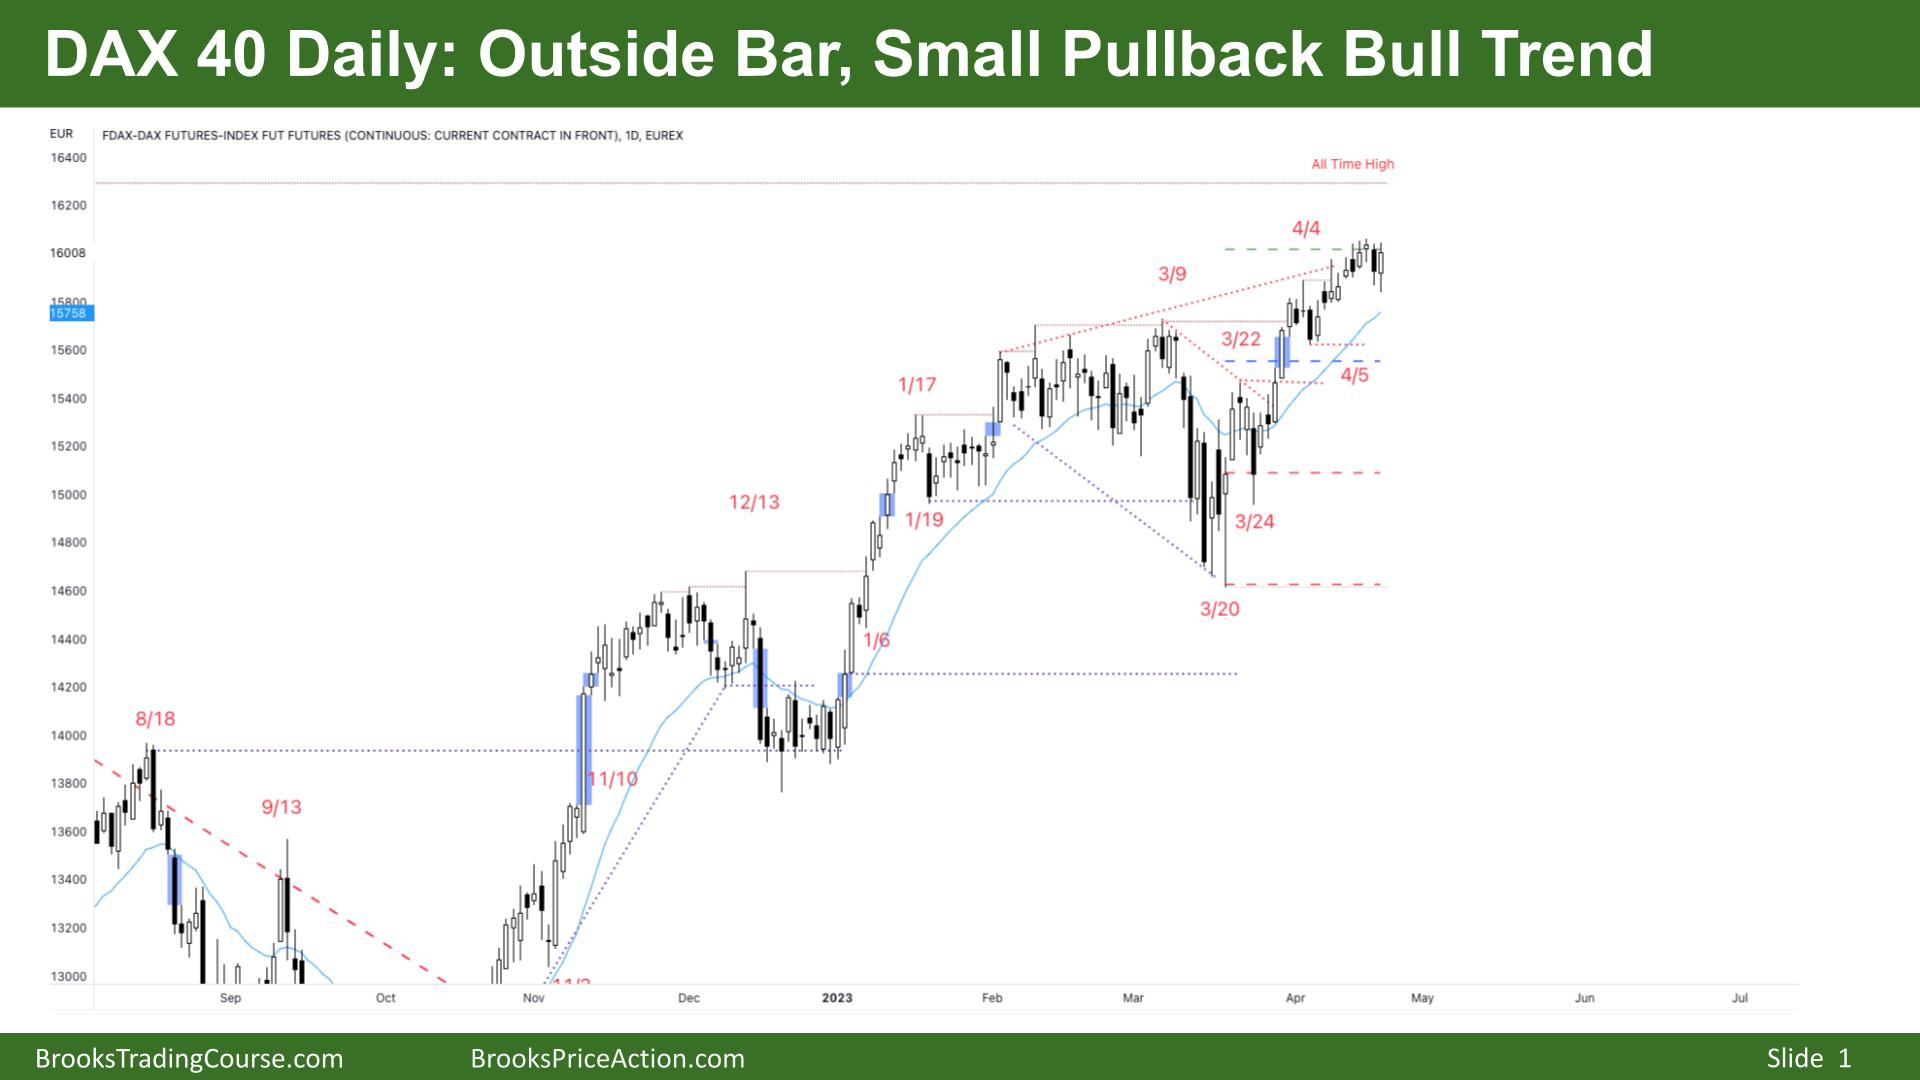
The Daily DAX chart

- The DAX 40 futures was a bull outside bar on Friday with tails above and below.
- The directional probability of an outside bar is in relation to how far it broke out below versus how far it broke out above.
- Because we broke out more below Thursday, sellers are probably above Friday’s bar.
- If you look left, you can see we’re going sideways, with many dojis and inside bars, and in the past few weeks, bull bars have been closing below their midpoints.
- So they are sell signals: One on April 4th and another on April 12th.
- Bears might see that as a possible wedge top and expect two legs sideways to down to the moving average.
- The bulls will see any move back to the moving average as a chance to scale in lower.
- It was a tight ball channel, and traders expected buyers below Wednesday. Still, Thursday took out the lows of four prior days, which is surprising.
- Therefore traders might expect a second leg, so there are probably sellers above Wednesday and Thursday.
- The bulls see an expanding triangle and a bull channel.
- Expanding triangles in trends generally become continuation patterns, so the best the bears can get is probably sideways to down to the breakout point above February and the wedge top.
- Bulls saw the wedge top and expected two legs sideways to down in February, and we broke out above, and this is probably the third leg up.
- Can you sell here? It’s not a great sell signal, so next week, we’ll probably set up another bar that’s better to sell.
- Most traders won’t buy above Friday because it’s an outside down bar, but probably buyers below.
- The best choice here is flat or long.
Market analysis reports archive
You can access all weekend reports on the Market Analysis page.

