Market Overview: DAX 40 Futures
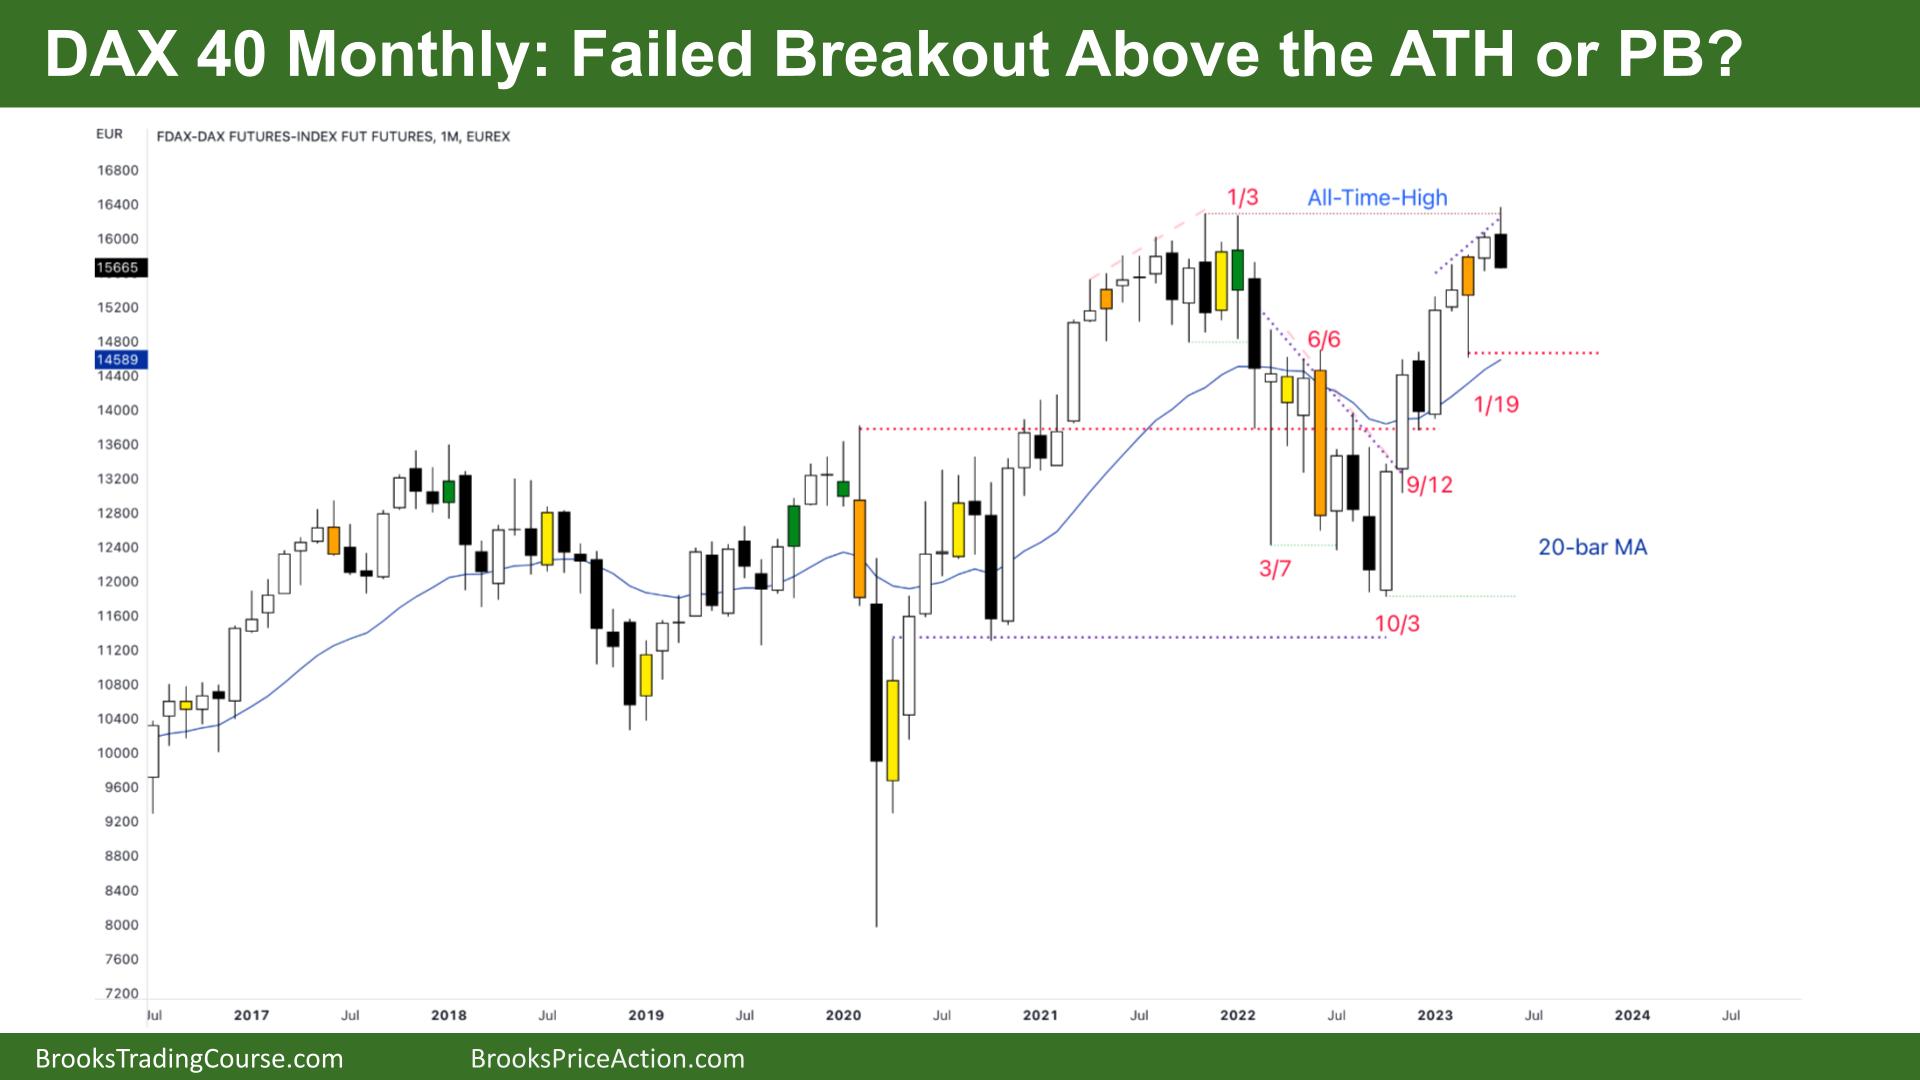
DAX futures moved down with a Dax 40 failed breakout making a new All-time High (ATH) last month. When higher time frames (HTF) signals get triggered, they often pull back first. It is confusing as it was a tight trading range (TTR) to the left and a possible double top (DT). The bears might see a parabolic wedge top here to sell for 2 legs down. But the bulls have been making all the money. Expect more sideways next month, possibly letting out the bulls who bought high.
DAX 40 Futures
The Monthly DAX chart

- The DAX 40 futures was a failed breakout with a bear bar closing on its low, so we might gap down next month.
- Note: The report was written after that day, so we know it did not gap down and instead reversed immediately.
- The bulls see a breakout (BO) above the ATH, and we triggered the buy above but did not close. They see a pullback and will look for a resumption to test that reasonable entry.
- The bears see a Higher High DT and a failed BO above the high of a trading range and will look for a Low 2 short to swing down.
- Swing signals often fail at extremes of trading ranges – so a High 2 will likely fail here.
- The bulls want a reversal bar, but they might wait for the bears to have 2 attempts here to reverse. We are far above the MA, and the surprise bull outside bar – panted in orange is confusing.
- That bar broke far below the others. So it is a bear BO and should get a second leg down.
- The bottom of that outside bar is also the new swing low and the start of a trading range. It is a magnet. Bears would need to break that low to do any real damage to this trend.
- The open bull gaps are wide. That means there are many buy zones below.
- So it is more likely the sellers here are profit-taking bulls.
- It is a reasonable swing sell below this month with a target of the MA, but many will scalp out if it fails.
- Expect sideways to down next month.
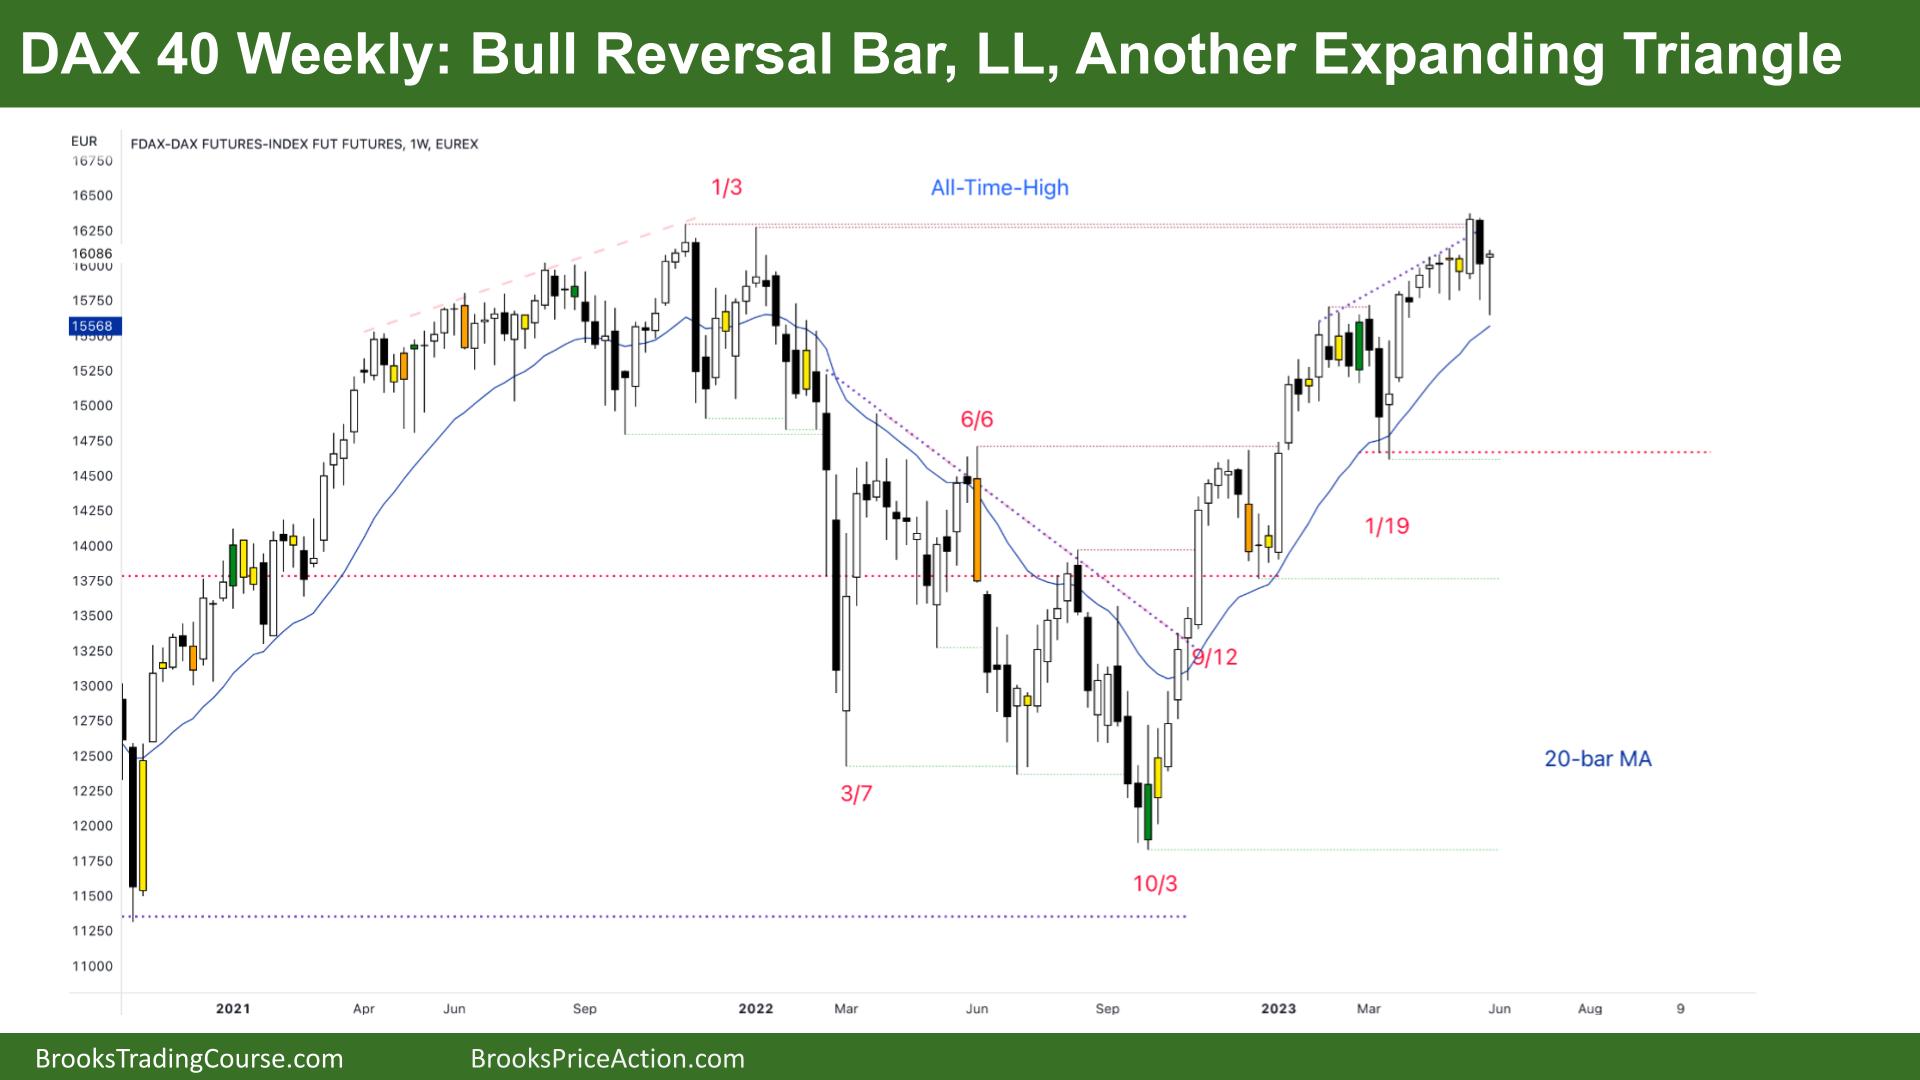
The Weekly DAX chart

- The DAX 40 futures last week was a bear bar but a bull reversal bar closing near its high.
- It is confusing because we went below last week, but no swing sellers were holding into the close.
- The bears see duelling lines – a larger double top with a wedge top forming the second top. A common double top (DT) pattern. But it is so bullish!
- This is common at the top of trading ranges here. It seems too bullish to short.
- The bulls see a tight bull channel, 3 pushes up, but no bars below the MA in more than 5 months. That is unsustainably strong.
- Why unsustainable? Because of profit taking. But there are strong bull gaps below.
- The bears see we are higher in a trading range and closed the gap at least with a wick, but not a body. Scale in bears made their first bit of money in months. That alone has the potential to encourage more sellers above now.
- But probably not on stops.
- A few weeks ago, it was a reasonable buy below the inside bar, betting a failed bear BO.
- And it was reasonable to short the ATH after such a deep pullback on the monthly chart.
- Scale in bulls will buy here to make money or reduce a loss from a high buy. But it was a reasonable buy-a-new high strategy with a wide stop. So we should let them out breakeven.
- Bears want to sell but might sell above the bear bar instead or the midpoint taking a chance at a higher low – but not on this timeframe yet.
- Most traders should be long or flat and expect sideways to down next week.
Market analysis reports archive
You can access all weekend reports on the Market Analysis page.

