Market Overview: DAX 40 Futures
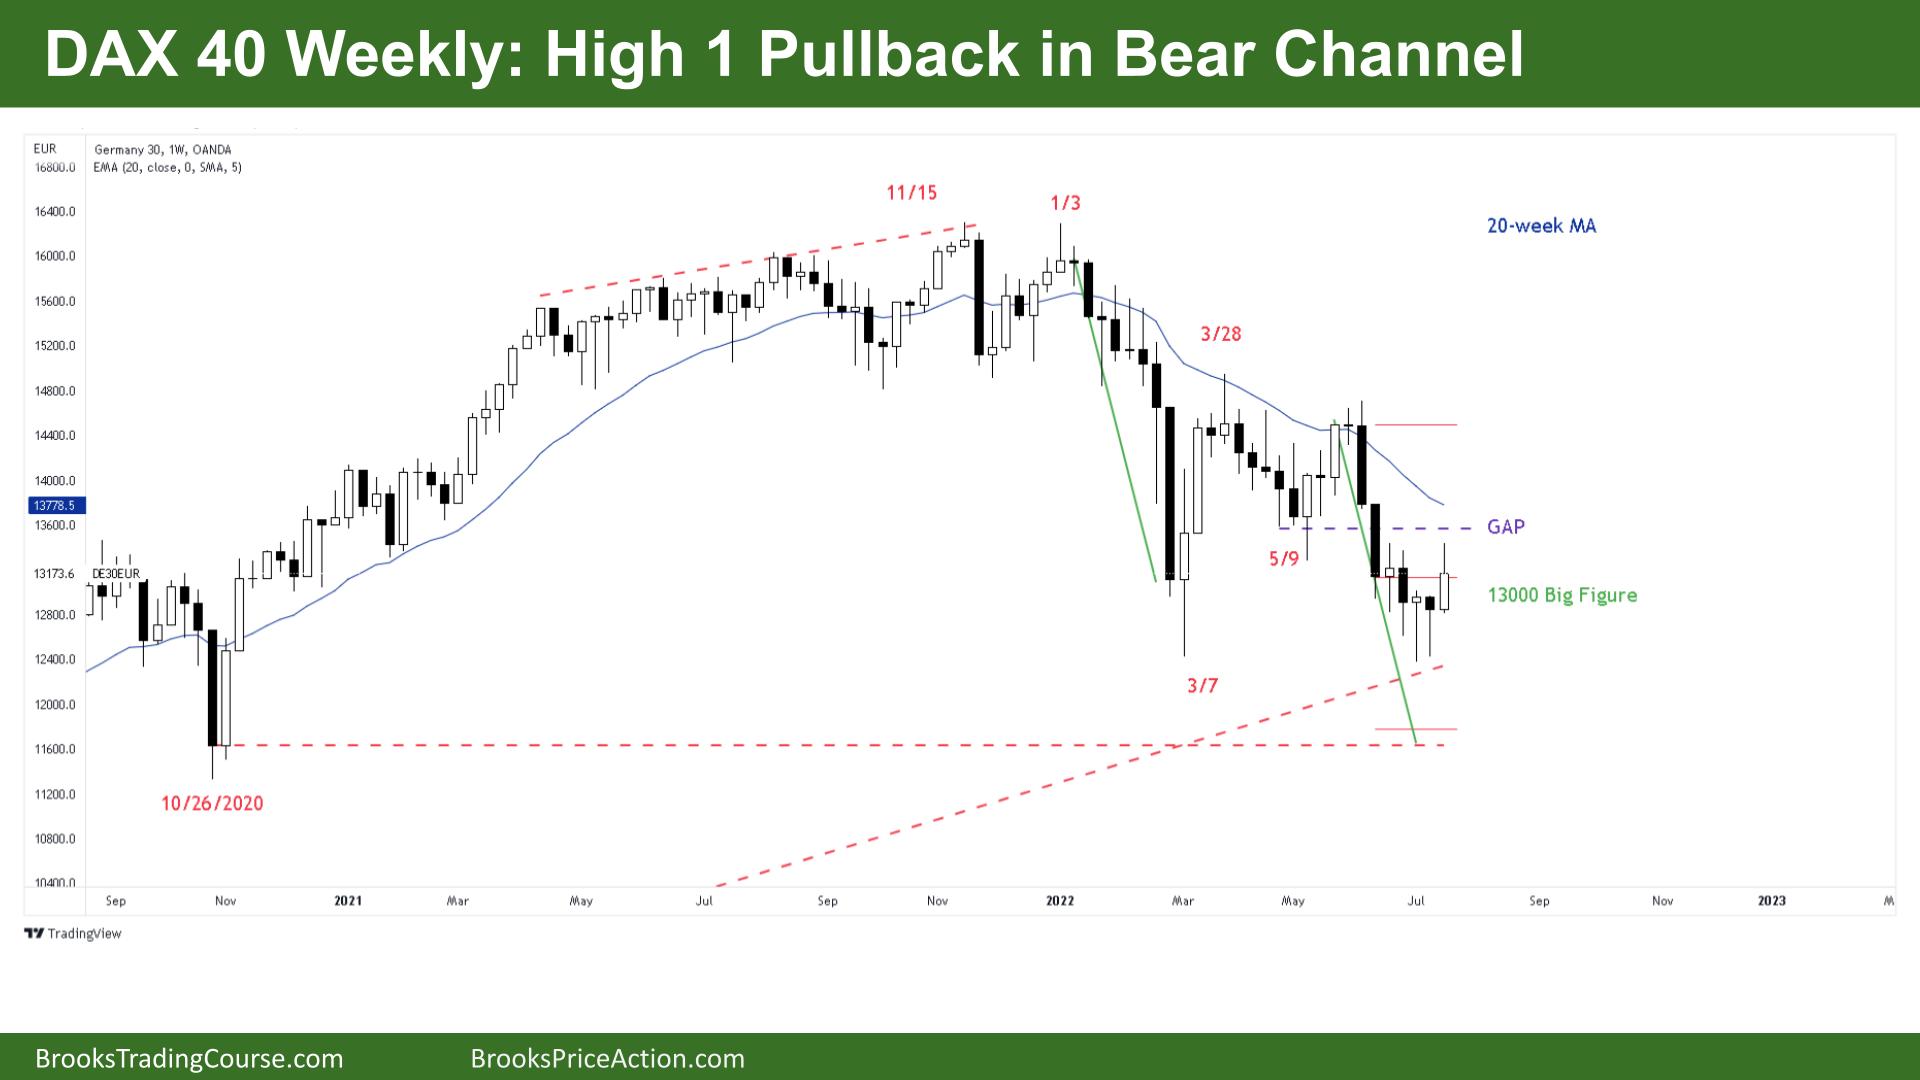
DAX futures was a High 1 Bear Channel Pullback. It’s a major trend reversal on the daily timeframe but still always in short on the weekly. Confusion, sideways but probably more upside as we are struggling to get below the March lows. Both DAX and FTSE are looking stronger but likely scalping to continue until strong moves either way.
DAX 40 Futures
The Weekly DAX chart

- The DAX 40 futures on the weekly chart was a bull bar with a tail on top. It’s a High 1 bear channel pullback.
- The bulls see a double bottom with March 7th and a lower low major trend reversal buy setup. It’s a second entry buy signal low in a sideways market so it’s a higher probability buy.
- The signal bar is not great, but perfect trades don’t exist otherwise there would be no institution to take the other side!
- They see the sideways price action and the buying below bars and scaling in so expect a reversal higher soon.
- The bears see High 1 pullback and a tight bear channel. They see the gap above and will short right up to it and above it where they expect bulls to give up.
- They see we are always in short still but have not had great follow-through. 2 bear bars, doji. Bear bar, bull bar then bear bar. Confusion.
- When there is something wrong with the trend you need to be looking to trade like a channel/trading range, not as a stop entry trader.
- The bears want a reversal bar here or higher, more likely up at the moving average. They want the second half of their measured move but we might have to go higher to continue it.
- If you’re short you can exit above last week or if you’re experienced sell higher.
- If you’re long, look to take partial profits at the gap or moving average.
- If you’re flat, there is nothing to short yet but you can buy above last week for a swing. Better to buy a consecutive bull bar closing above it’s midpoint.
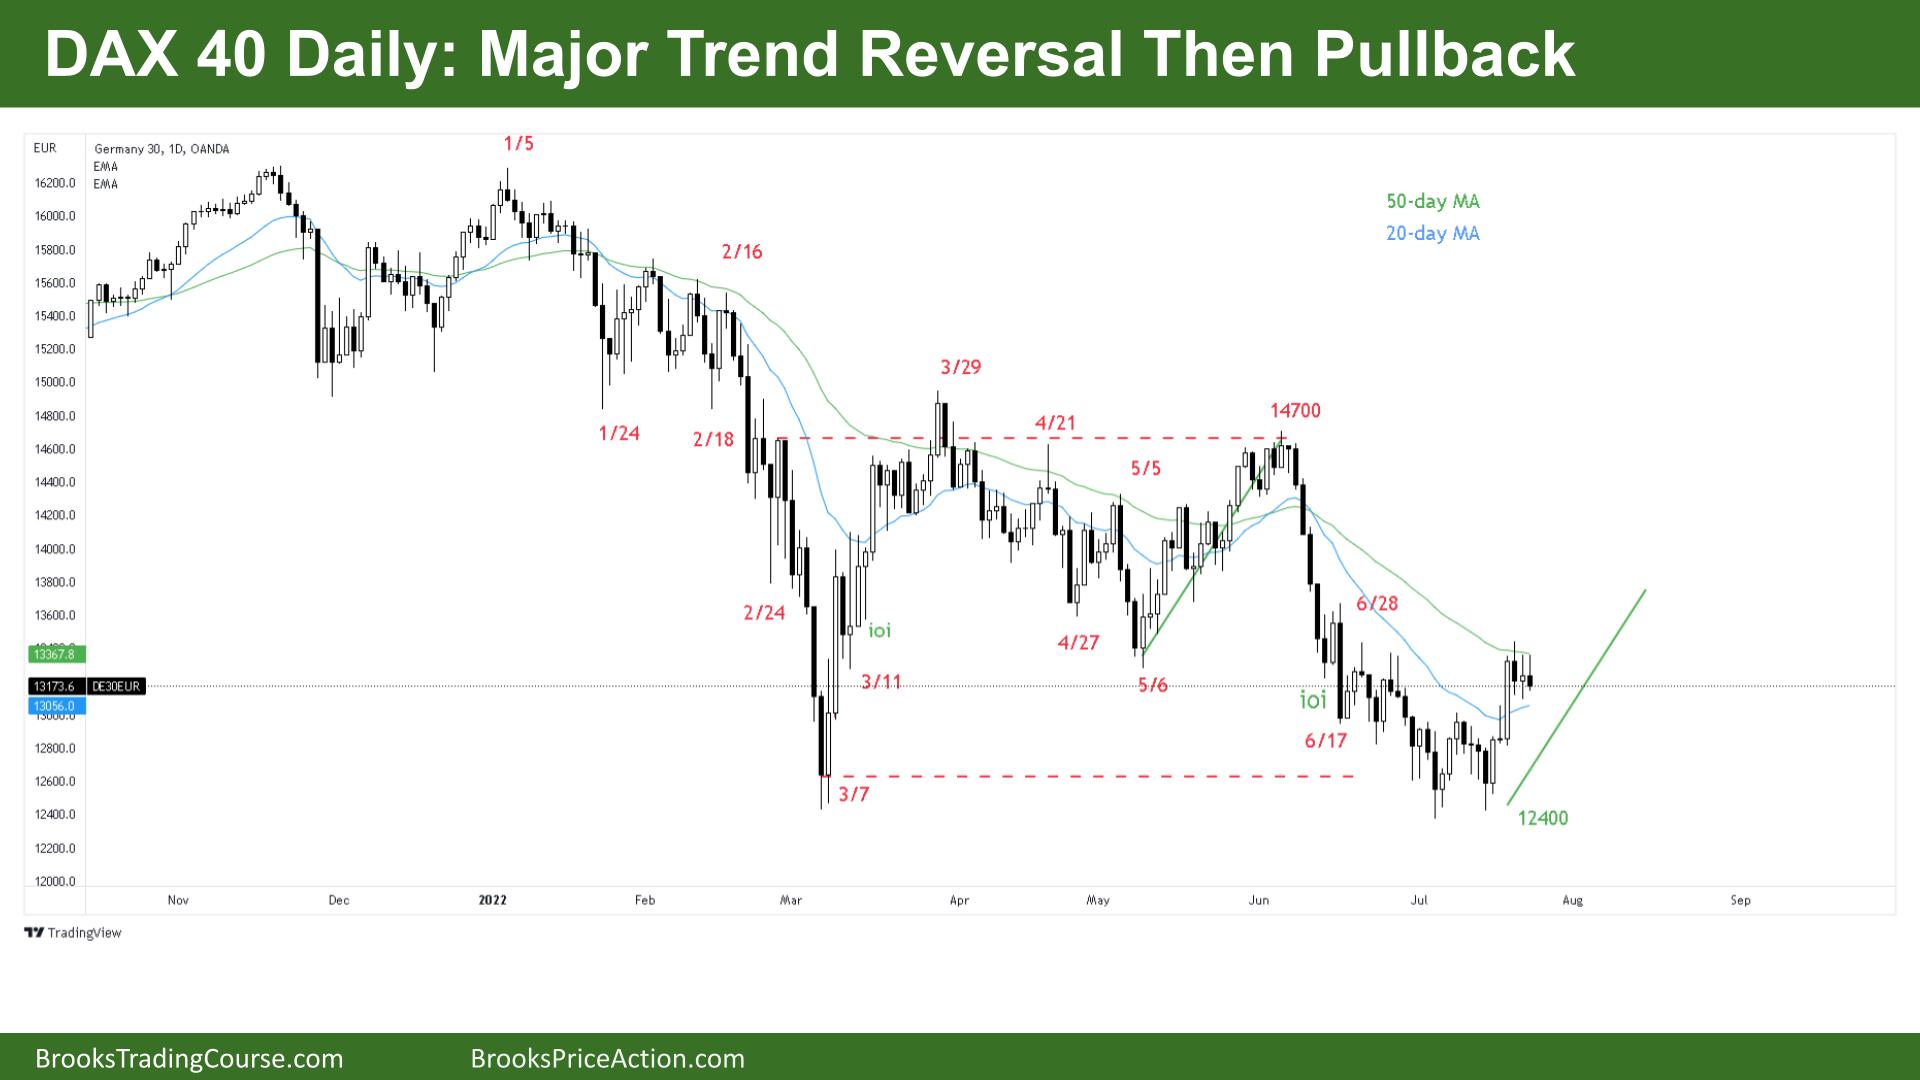
The Daily DAX chart

- The DAX 40 futures daily was a small bear doji on Friday.
- The bulls see a bull breakout and a pullback. They see a major trend reversal after a wedge, double bottom with March or July triple bottom.
- They are expecting a measured move higher back up to 14000. A High 1 pullback on the weekly and High 1 buy setup on the daily.
- The 50-day moving average has been resistance for many months now so we might pull back a bit deeper.
- They also see the moving average gap bar sell didn’t work yet and might fail as bears give up to sell higher.
- For the bears it’s a bear spike and channel and we are forming the upper side of the channel so they will look to sell higher.
- They know the best the bulls can expect here is a trading range and so will scalp out if there are too many sideways daily bars. Right now is an example where they might exit and buy lower.
- The bears want consecutive bear bars for a second entry to sell back down to 13000 or 12500 at the lows.
- The bears see that the biggest bars n the last 6 weeks have been bull bars. They are starting to get 2/3 consecutive bars which tells you that the buying power is increasing.
- If you’re long, look to add on below Thursday or get out if the bears get consecutive bear bars. Currently, a gap above Monday is open still.
- If you’re short, get out at the High 2 above Friday. Wait to get short again below a bear bar closing on it’s lows.
- If you’re flat, look for a good looking signal bar in either direction but look to enter on the follow-through.
Market analysis reports archive
You can access all weekend reports on the Market Analysis page.

