Market Overview: Crude Oil Futures
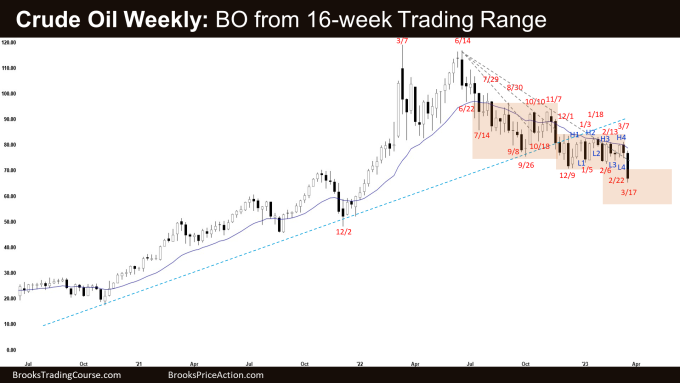
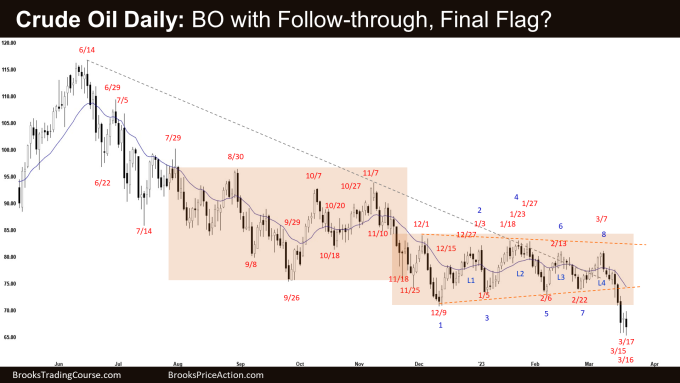
Crude oil strong breakout below the 16-week trading range. They want a measured move down to around 57 using the height of the 16-week trading range. The bulls want a failed breakout and a reversal back into the middle of the trading range from a lower low major trend reversal and a wedge pattern (Sept 8, Dec 9 and Mar 17).
Crude oil futures
The Weekly crude oil chart

- This week’s candlestick on the weekly Crude Oil chart was a big bear bar closing near its low.
- Last week, we said that odds slightly favor Crude Oil to trade at least a little lower and traders will see if the bears can create a strong follow-through bear bar or will the market trade slightly lower but stall and close with a bull body or a long tail below.
- The bears got a consecutive bear bar breaking below the 16-week trading range.
- They triggered the L4 (Low 4) sell signal and got follow-through selling this week.
- They will need to continue creating strong follow-through selling to increase the odds of a measured move down to around 57 using the height of the 16-week trading range.
- The bulls want a failed breakout below the 16-week trading range.
- They hope that the tight trading range is the final flag of the move down.
- They have broken the bear trend line by trading sideways.
- They want a reversal back into the middle of the trading range from a lower low major trend reversal and a wedge pattern (Sept 8, Dec 9 and Mar 17).
- Because of the strong selloff, the bulls will need at least a strong reversal bar or a micro double bottom before they would be willing to buy more aggressively.
- Since this week is a big bear bar closing near the low, it is a weak buy signal bar for next week. It is a good sell signal bar.
- Odds slightly favor the Crude Oil to trade at least a little lower.
- Traders will see if the bears continue to get follow-through selling or will next week trades slightly lower but stalls and close with a bull body or a long tail below.
The Daily crude oil chart

- Crude Oil broke below the triangle and 16-week trading range with follow-through selling.
- Last week, we said that Crude Oil formed a triangle pattern and is in breakout mode and traders should be prepared for breakouts to fail unless there is strong follow-through price action following the breakout.
- Recently, the bears got a reversal lower from a double top bear flag (Feb 13 and Mar 7).
- They then triggered the larger L4 (Low 4) sell signal and got follow-through selling breaking far below the triangle with follow-through selling.
- They want a measured move down using the height of the 16-week trading range which will take them to around 57.
- If Crude Oil pullback higher, they want at least a small second leg sideways to down, testing March 17 low.
- The bulls want a failed breakout below the 16-week trading range.
- They have broken the bear trend line by trading sideways.
- They hope that the trading range will be the final flag of the move down and want a reversal higher from a wedge pattern (Sept 8, Dec 9 and Mar 17).
- They also hope that Thursday inside doji is a one-bar final flag of a climactic selloff with March 15 and March 16 forming a micro double bottom.
- The last 3 candlesticks have a lot of overlapping price action and prominent tails below.
- Crude Oil could be forming a trending trading range.
- Since Friday was an outside bear bar with a long tail below, it is a weaker sell signal bar.
- For now, odds slightly favor Crude Oil to get at least a small second leg sideways to down following any pullback (bounce).
Market analysis reports archive
You can access all weekend reports on the Market Analysis page.


I would add a spike and channel bear trend to the possible patterns in crude.
Dear Andrew,
A good day to you..
Yeah, that’s certainly another possible situation..
The market has been very choppy.. deep in the red earlier, and now more or less flat..
Let’s see how it plays out in the next couple of weeks..
Have a blessed week ahead Andrew..
Best Regards,
Andrew
Hello, Andrew! In the weekly chart, do you think Triangle Final Flag lead to Final leg down?
Dear TP,
Yes, that’s a possibility.. that’s what the bulls want.
Another possible situation is a trending trading range.. we form another trading range at slightly lower levels maybe around 57 and 70..
On the Monthly chart, if March closes at the low, it doesn’t have a good look for the bullish case. Will keep an eye out for this.
Let’s see how it plays out over the next several weeks.
Have a blessed week ahead TP.
Best Regards,
Andrew
Thank you! You help me have an another view.
You’re most welcome TP.
Have a good week ahead!
Best Regards,
Andrew
Thanks for your report Andrew, yours triggered my interest for the Crude oil futures since a while. Last week tested the pre-pandemic high (January 2020), so an obvious target for the next move. Let’s see how that develops the next couple of weeks. All best!
Dear Sybren,
A good day to you.. thank you for going through the report..
Yeah.. let’s see how it plays out over the next couple weeks..
Wishing a blessed week ahead to you..
Best Regards,
Andrew