Market Overview: Bitcoin
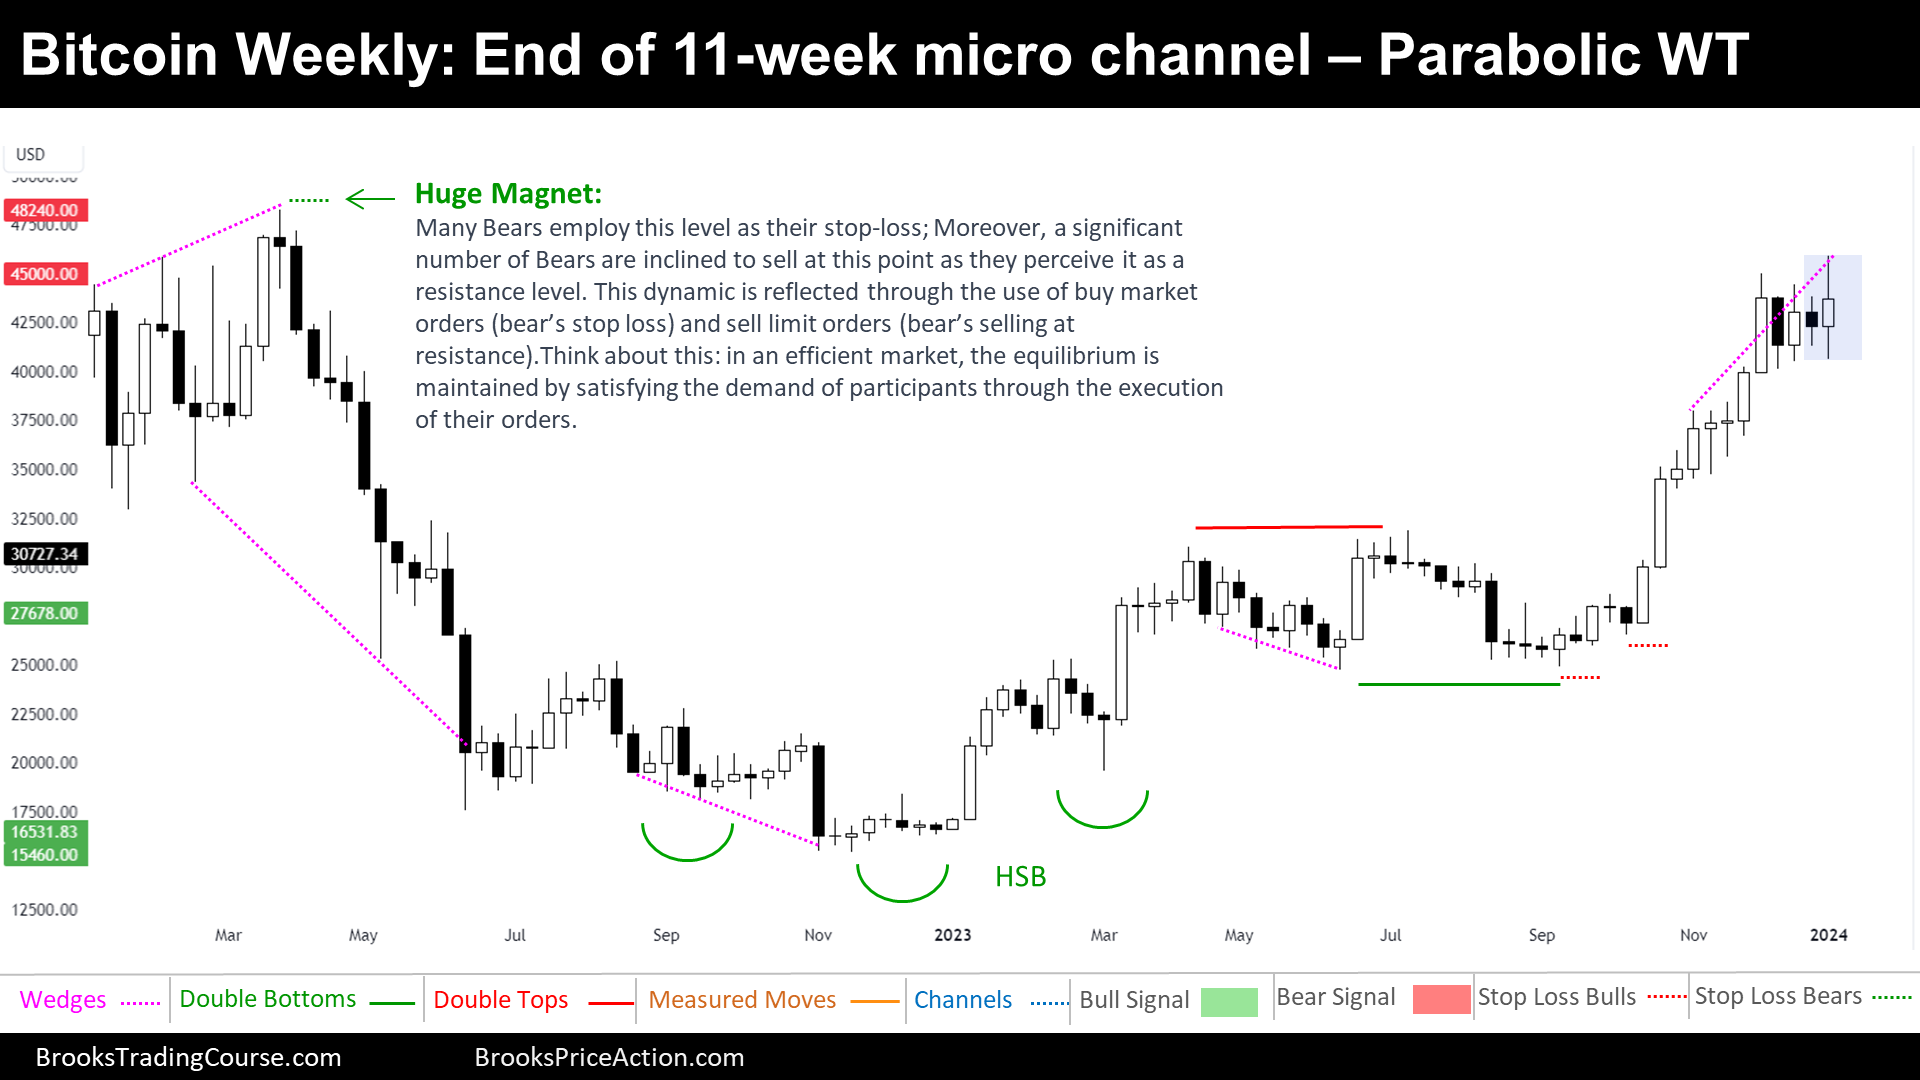
Bitcoin is trading upwards towards a strong magnet. In this week’s, we observed a notable shift as prices surged above the 2023 high, only to experience an immediate sell-off. The subsequent dip resulted in trading below the prior weekly low, marking the end of a series of consecutive weekly higher lows, signaling the end of the 11 bull micro channel.
A significant factor influencing the current market price is the presence of a substantial magnet above the price. This is attributed to numerous traders positioning their orders beyond the 2022 high, which has established itself as a robust resistance level. The market always exhibits its tendency to meet demand, a critical aspect shaping its dynamics.
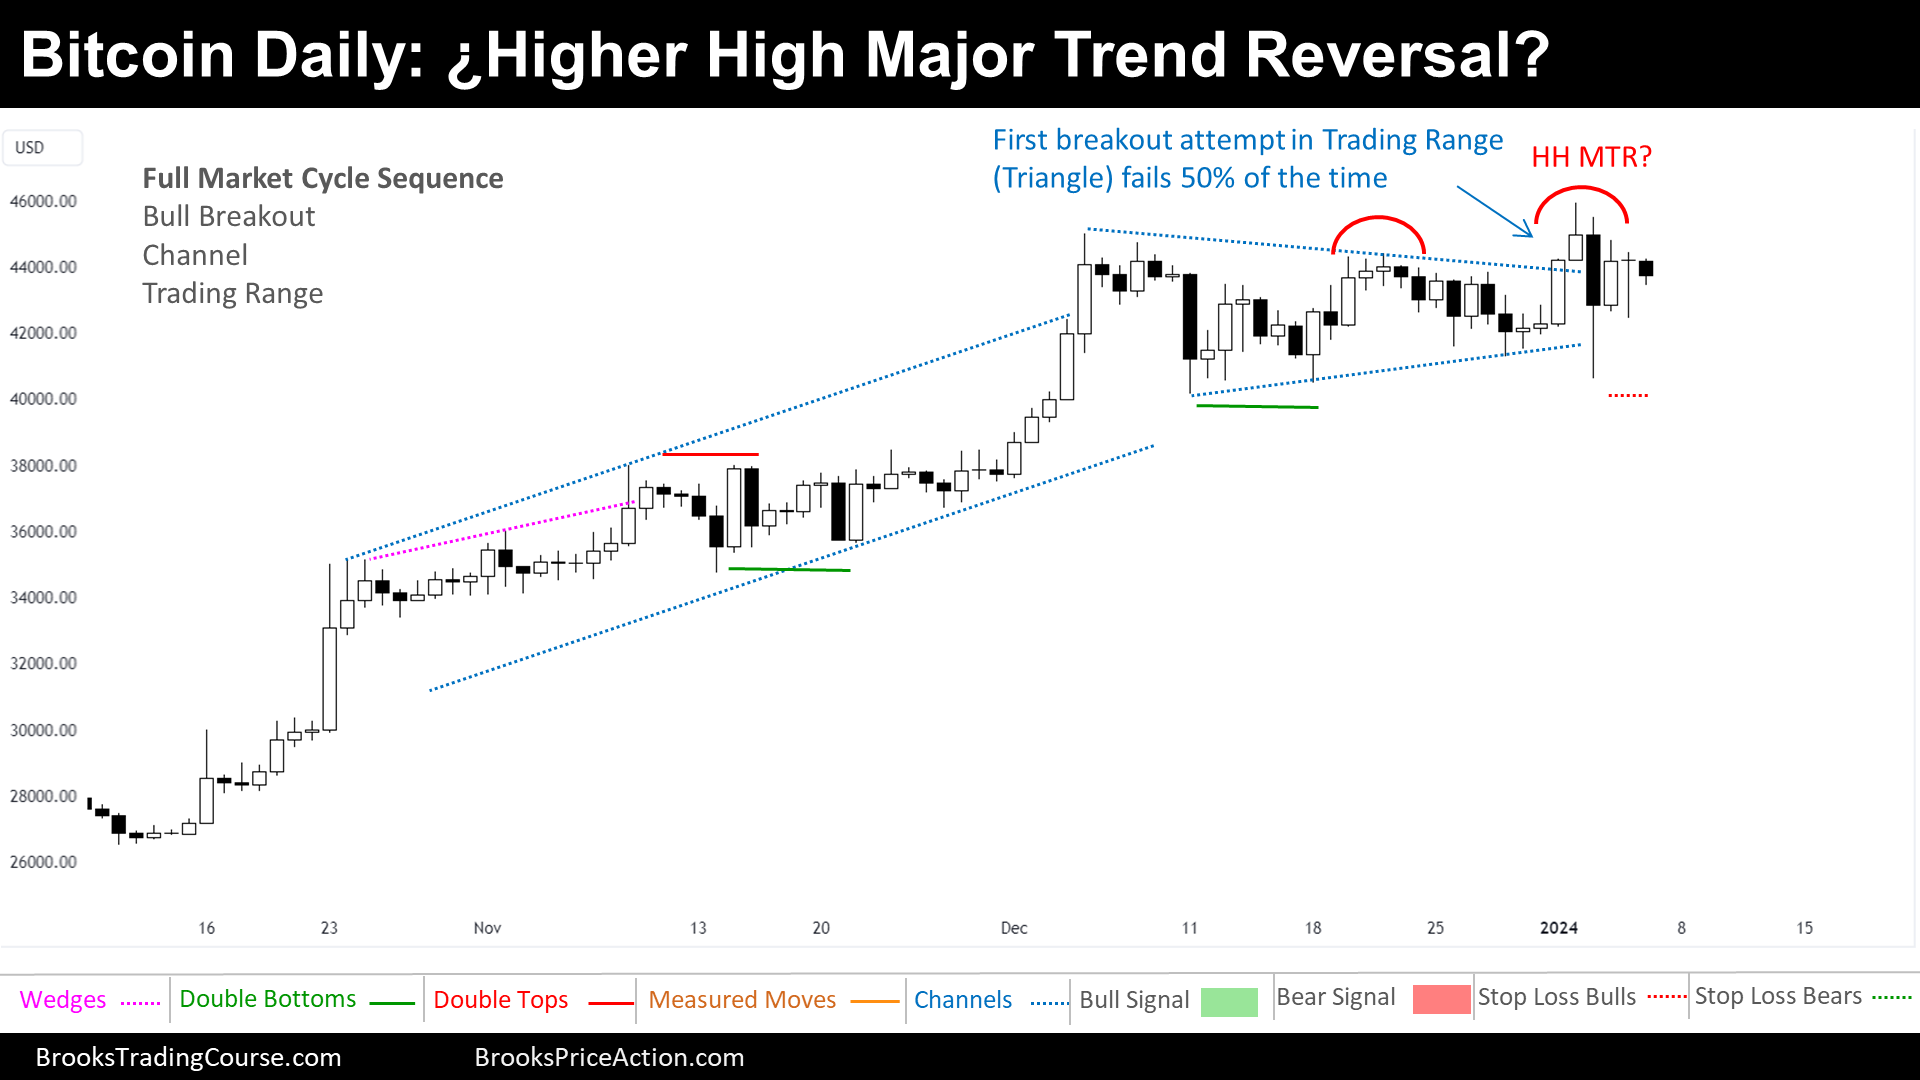
Examining the daily chart, there are indications of a potential reversal downward. This prompts a crucial question: ¿Can the price successfully reverse down, and contend the formidable price magnet depicted in the weekly chart?
Bitcoin
The prices depicted on our charts are sourced from Coinbase’s Exchange Spot Price. It’s crucial to note that the spot price of Bitcoin is continuously in motion; trading activity never ceases. This means that market fluctuations and price changes occur around the clock, reflecting the dynamic nature of cryptocurrency trading.
The Weekly chart of Bitcoin

The current scenario unfolds as a potential bull breakout, although nuances in the trend dynamics are worth noting. The bull breakout appears to have reached a point of exhaustion. Without the left side of the chart, Traders would expect a transition from a Bull Breakout into a Bull Channel, and then a Trading Range. But, the awareness that the price has encountered a robust resistance area tempers expectations, raising questions about the sustainability of a full-fledged spike and channel bull trend.
Anticipating future movements, a potential trading range scenario emerges, implying an impending bear leg following the current bull leg. Before such a shift, however, the price is likely to gravitate towards the 2022 high, a level bustling with participant activity. This region is marked by buy market orders from bears that sold during the bull breakout, and sell limit orders from the bears that are anticipating a resistance sell-off. This area serves as a hub of market activity, highlighting the efficiency of markets in gravitating towards equilibrium by satisfying orders.
While the market could continue its upward trajectory or even experience a robust spike above the 2022 high, caution is warranted. A bear leg down is likely to follow, irrespective of potential catalysts such as ETF approval or post-Bitcoin halving scenarios.
The Daily chart of Bitcoin

Over the past month, Bitcoin has traded within a defined range of $40,000 to $45,000.
The current market cycle reveals a consolidation phase within a trading range, a period of respite following a robust Spike and Channel Bull Trend. This consolidation is visually represented by a Bull Flag (or Final Flag), which also takes the form of a Triangle pattern. Traditionally, a Triangle or any Trading Range presents a 50% probability of breaking either up or down. Given the preceding Bull Trend, there is a theoretical bias towards an upward breakout. Furthermore, the presence of an influential weekly chart magnet above suggests a higher likelihood of an upside breakout.
This week witnessed an attempt at a Bull Breakout, with the market breaking above the Triangle, only to experience a swift reversal downward. The failure of the initial breakout is not uncommon, occurring 50% of the time during the first breakout attempt of a Triangle or any Trading Range.
Looking ahead, the next breakout, whether upward or downward, carries improved chances of success. Following the failed Bull Breakout, bears may interpret the unfolding pattern as a Higher High Major Trend Reversal, forming a potential Head and Shoulders Top.
Despite this interpretation, strong bulls remain eager to buy, driven in part by the presence of the weekly magnet. Additionally, the initial Bull Breakout served to shake out weak bulls who positioned their stops below the minor higher low. Now, other bulls have strategically entered with buy market orders above the Triangle High, setting their stop-loss orders below the Triangle.
In the future, strong bulls are anticipated to engage in buying both a breakout above the current high and a reversal up from a failed breakout below the Triangle. The bulls have their sights set on the weekly magnet at approximately $48,300 and potentially beyond, reaching towards the $50,000 mark.
Bears, on the other hand, aim to enter the market below a Lower High Major Trend Reversal, structuring a swing trade that offers a 40% chance of obtaining twice what they are risking.
In summary, while the price of Bitcoin appears to have a higher probability of trading upwards, traders are reminded to trade what they observe. Flexibility is key, especially in the face of evolving market conditions. As the market presents opportunities, traders should be adaptable, ready to adjust strategies based on the emergence of new patterns and trends.
We invite you to keep the conversation alive by sharing your thoughts in the blog comments. Let’s build a vibrant discussion space together! If you found our content intriguing, spread the word on social media—your support fuels our journey. Until we meet again, keep exploring, sharing, and inspiring.
Josep Capo
Market analysis reports archive
You can access all the weekend reports on the Market Analysis page.


Traders know BTC has deep pullbacks and then makes a new high. 70k is the min target. A multiple of the the previous ATH is realistic like 150k.
yeah mostly likely perhaps even beyond ( 240k? ) but i think 50k as target in this analysis is for current market conditions and not for multi year long Market cycle for Bitcoin
Hi Sadik Can Bayar,
Thanks for your input! You’re right, the target of 50k in my analysis was indeed considering the current market conditions. I agree that when looking at the broader multi-year market cycle for Bitcoin, higher targets could well be within the realm of possibility.
Your insights are appreciated, and it’s an exciting journey to see how Bitcoin’s market dynamics play out in the long run.
Please have no hesitation to share more of your thoughts, and let’s continue to follow the market closely!
Best regards,
Hey Erik,
Thanks for sharing your thoughts! I appreciate your perspective on Bitcoin’s potential.
The target was for the upcoming days or weeks, and it’s great to see that the price movement that followed confirmed those expectations.
I agree that Bitcoin has a history of deep pullbacks followed by new highs, but I think this is not happening soon since we have entered into a sell zone to me.
Let’s keep a close eye on the market and see how things unfold. Feel free to share any further insights or updates!
Best regards,
Josep
BTC is going much higher than 50K!
January 23 Break above year long bear trend line on 1M chart
October 23 Break above 25-32K Range on 3D chart
December 23 Break above tight bull channel on 1D chart
all three BO’s seem to have their two legged MM up target at 51600
Absolutely, it’s great to see your detailed analysis. The series of breakouts you’ve highlighted, all point towards a positive trajectory. Your target of 51600 is still very much in play.
Your thorough chart analysis provides valuable insights, and I appreciate you sharing it.
Thanks for contributing to the discussion!
Josep