Market Overview: Bitcoin Futures
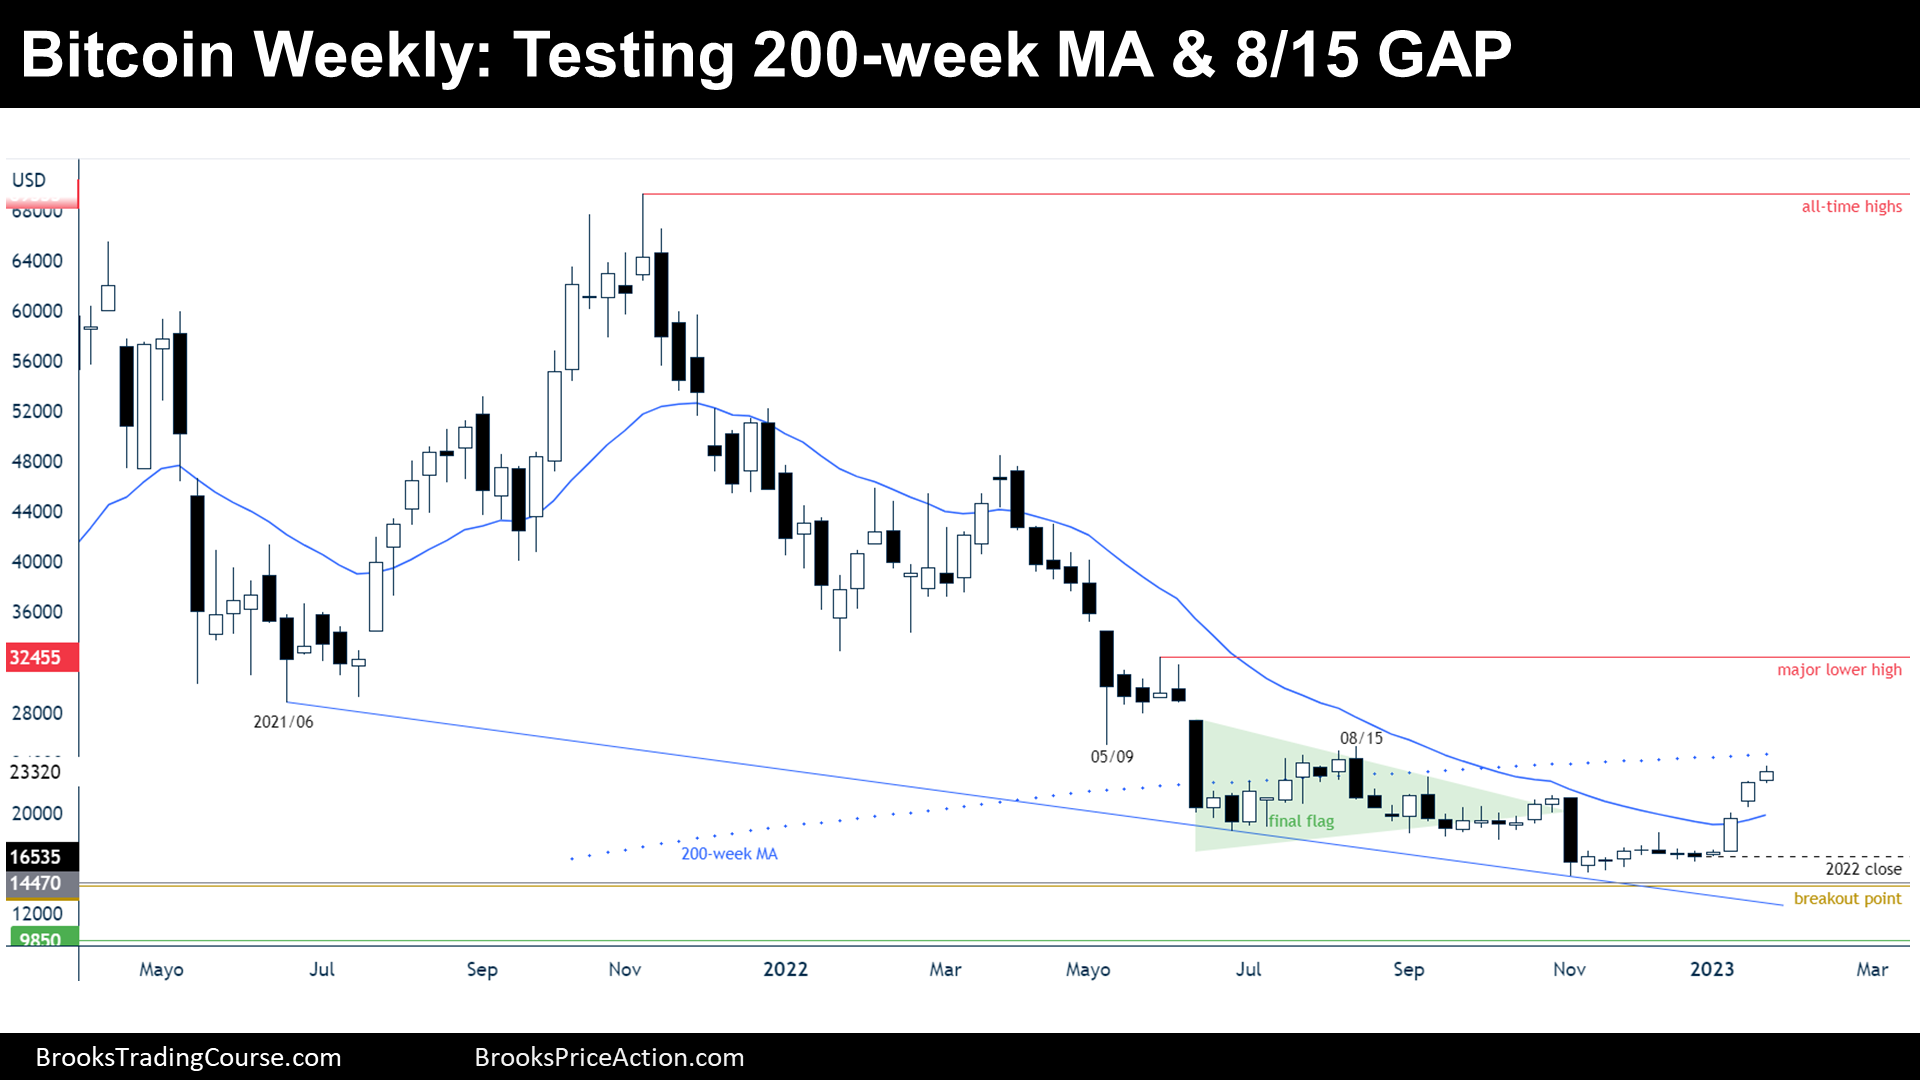
Bitcoin futures testing 200-week moving average. During the week, the price increased +4.15% of its value. Tuesday is the last day of the month; So far, the Bitcoin price is up in January by +39.85%.
Bitcoin futures
The Weekly chart of Bitcoin futures

Analysis
- This weekly candlestick is a bull bar with a prominent tail above. It is the third consecutive bull bar.
- During the previous report, I have said that the most likely outcome was another bull bar this week, and that is what happened.
- The bars are decreasing in size, which denotes a loss of momentum; thus, there will be probably a pullback starting during the next 1–3 bars.
- As I have been saying since June, the dominant market cycle on this timeframe is a Trading Range. During Trading Ranges, the gaps tend to close. Currently, the price is approaching and testing 200-week moving average and the August 15th gap.
- The most important gap is probably the 2021 June low.
- Between the August 15th high and the 2021 June low, the price should experience strong resistance and therefore, a leg sideways to down will be likely formed.
- Nowadays, the price is either:
- Bull case: A bull leg in a trading range is underway. The principal target for the bulls is to end the bear inertia before there is a new low. Technically, if the bulls get to the prior major lower high at $32455, the bear trend will be over. Trading around $30000 will mean that bulls buying and scaling in lower are making money, so they buy again below fresh lows.
- Bear case: There are strong resistances above and the bears will try to sell there, expecting to get a new low.
- Since the previous bars are decreasing in size, a pullback is expected starting during the following 1 to 3 weeks.
Trading
- Bulls: Current bar is a weak buy signal bar since it has a prominent tail above. The resistances above are strong, and bulls might wait to buy after a pullback and a double bottom or higher low.
- Bears: Bears will try to sell around the resistances that the price will face between $25000 and $30000.
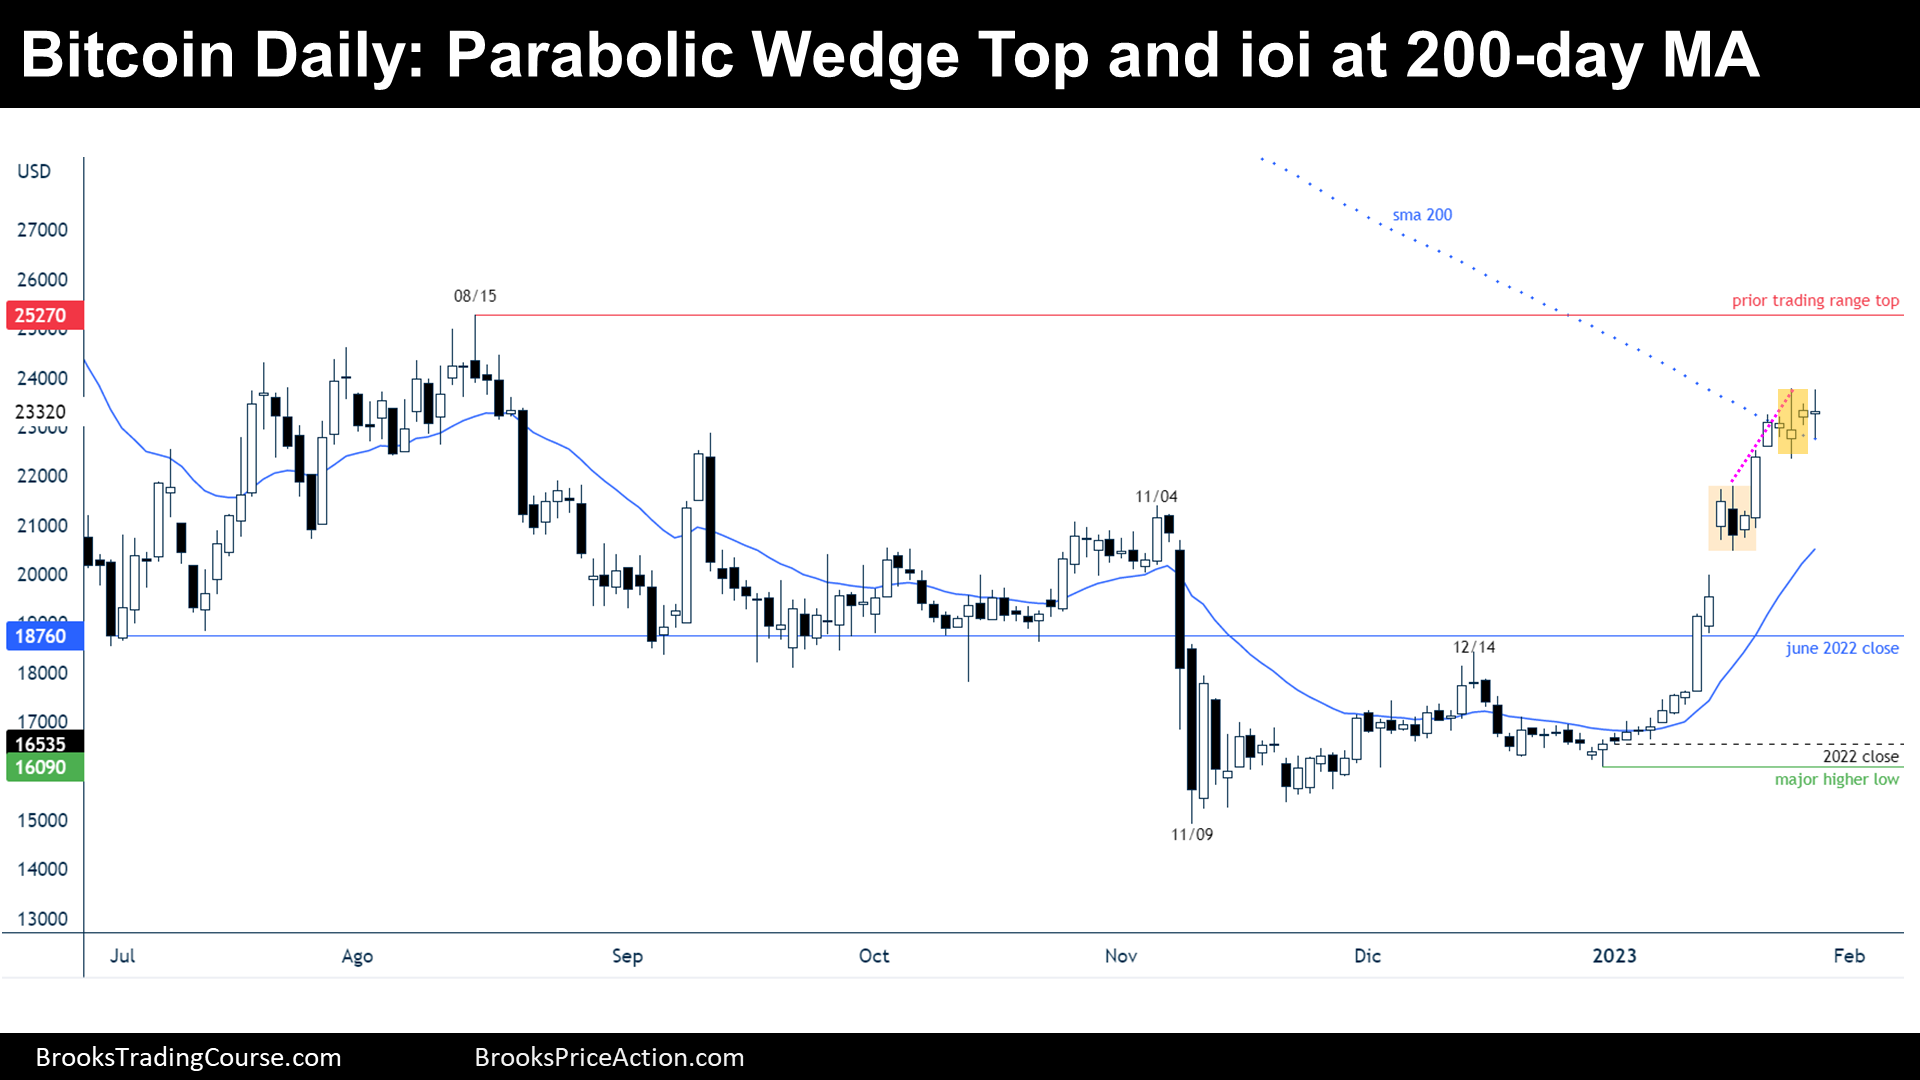
The Daily chart of Bitcoin futures

Analysis
- During the week, the price formed a parabolic wedge top and an ioi pattern.
- An ioi pattern after a parabolic wedge top it is probably a final flag.
- Furthermore, there are consecutive ioi patterns which suggest that the price might experience some sideways trading during the upcoming weeks.
- A parabolic wedge is a pattern that indicates exhaustion; the price is far from the 20-day exponential moving average, and hence, it might be tested during a hypothetical pullback. The November 4th high might act as support.
- But the bull leg is strong enough for traders to expect a test of the highs at some point into the future.
- Nowadays, the price is either:
- Bull case: Spike and channel bull trend. The price will experience a pullback that will fail, and the price will create higher lows and higher highs, channeling up.
- Bear case: Bears hope that the market cycle is in a Trading Range instead of a Bull Trend, thus, after this bull leg it will come a strong bear leg.
- Traders should expect sideways to down trading starting soon.
Trading
- Bulls: Bulls will probably wait to buy until a couple of legs down, to test the strength of the bears.
- Bears: Bears might have sold below the ioi pattern. It was not a strong pattern because the signal bar was a bull bar, so they might wait to sell correctly below a bear bar closing on its low.
Market analysis reports archive
You can access all weekend reports on the Market Analysis page.


Many thanks for the report Josep!
Question please: which high are you reffering here: “But the bull leg is strong enough for traders to expect a test of the highs at some point into the future.”
Hola Eli!
Thank you for your comment and the good question.
When the pullback comes, there will be a high that the price will probably test. Then, the high is not there yet, we will know which high it is once the pullback starts.