Market Overview: Bitcoin Futures
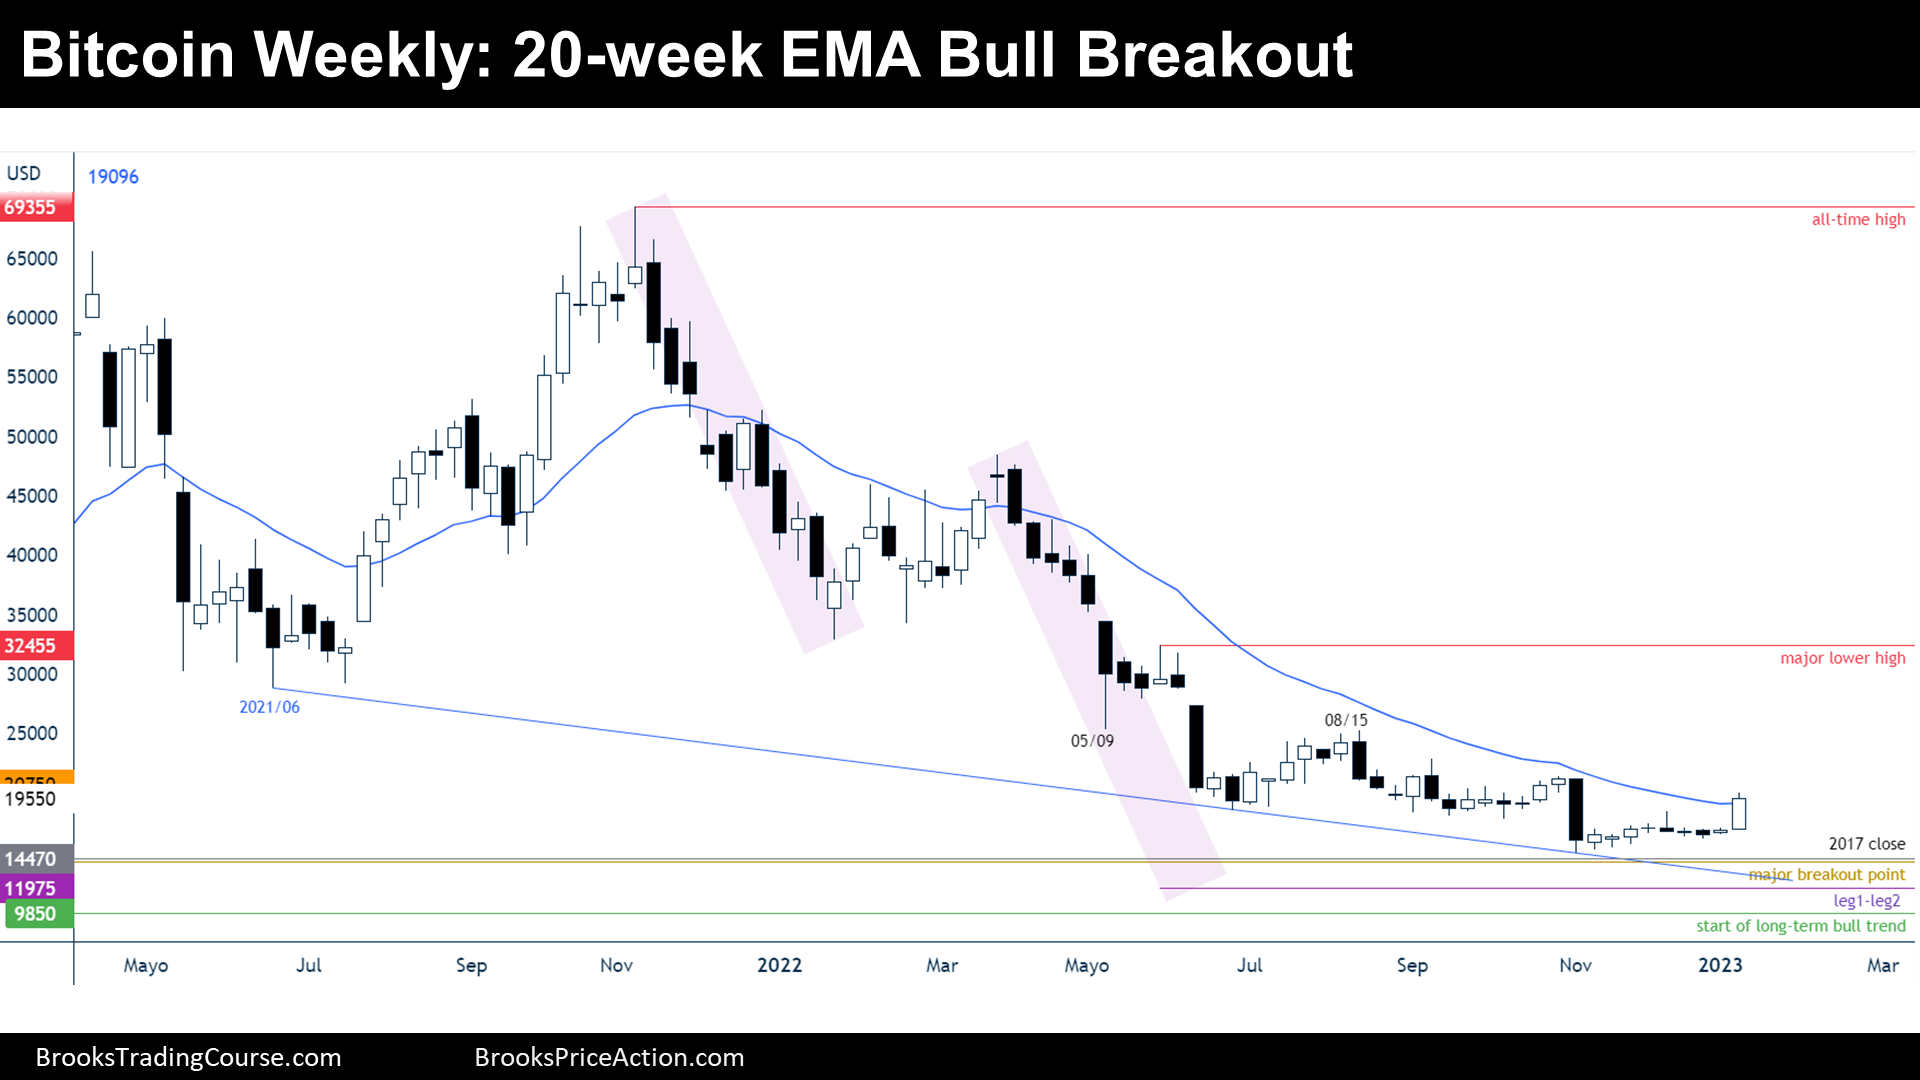
Bitcoin futures are testing the 20-week exponential moving average (testing 20-week EMA). During the week, the Bitcoin price increased +15.71% of its value. After 8 weeks of extremely low volatility, traders wonder if this is the start of a large move.
Bitcoin futures
The Weekly chart of Bitcoin futures

Analysis
- This weekly candlestick is a bull breakout bar that closed above the 20-week EMA. The bar gapped up on Monday and did not test the closing price of the past week, meaning that the bulls were eager to buy at the market, a sign that the bulls are in.
- It is the first time since May 2022 that Bitcoin closed a week above the 20-week EMA.
- The context is more likely a trading range instead of a bear trend, but if right after testing the EMA the price reaches a new low of the bear trend, the trading range market cycle will no longer be valid.
- When the price it is considered to be within a trading range, anything below the 20-EMA is considered “cheap”; anything above is considered “expensive”.
- Nowadays, the price is either:
- Bull case:
- Reversing up after a lower low major trend reversal or a final flag pattern.
- Bulls hope that this is the start of the long-awaited bull leg that will drive the price up to June 2021 low or to the prior major lower high.
- Bear case:
- Vacuum testing the 20 EMA before continuing the bear trend.
- Bears know that the first reversal up will be probably minor, since there are strong open gaps along the way up.
- Bull case:
- Since this week was a strong bull breakout bar following a breakout mode pattern (tight trading range) we should expect higher prices for the next week.
Trading
- Bulls:
- Bulls have a good buy signal bar after a final flag pattern. The probability is likely around 50% and the risk-reward ratio surpasses 1:2; Therefore, it looks good for the bulls if they place their Stop Loss below the current week’s low and take their profit around the June 2021 low.
- Bears:
- Bears might sell right at the 20 EMA, but they are coming from failing a bear flag trend continuation pattern; They know that the first reversal up will probably fail, and they might wait to sell higher, where many bulls will exit prior trapped longs.
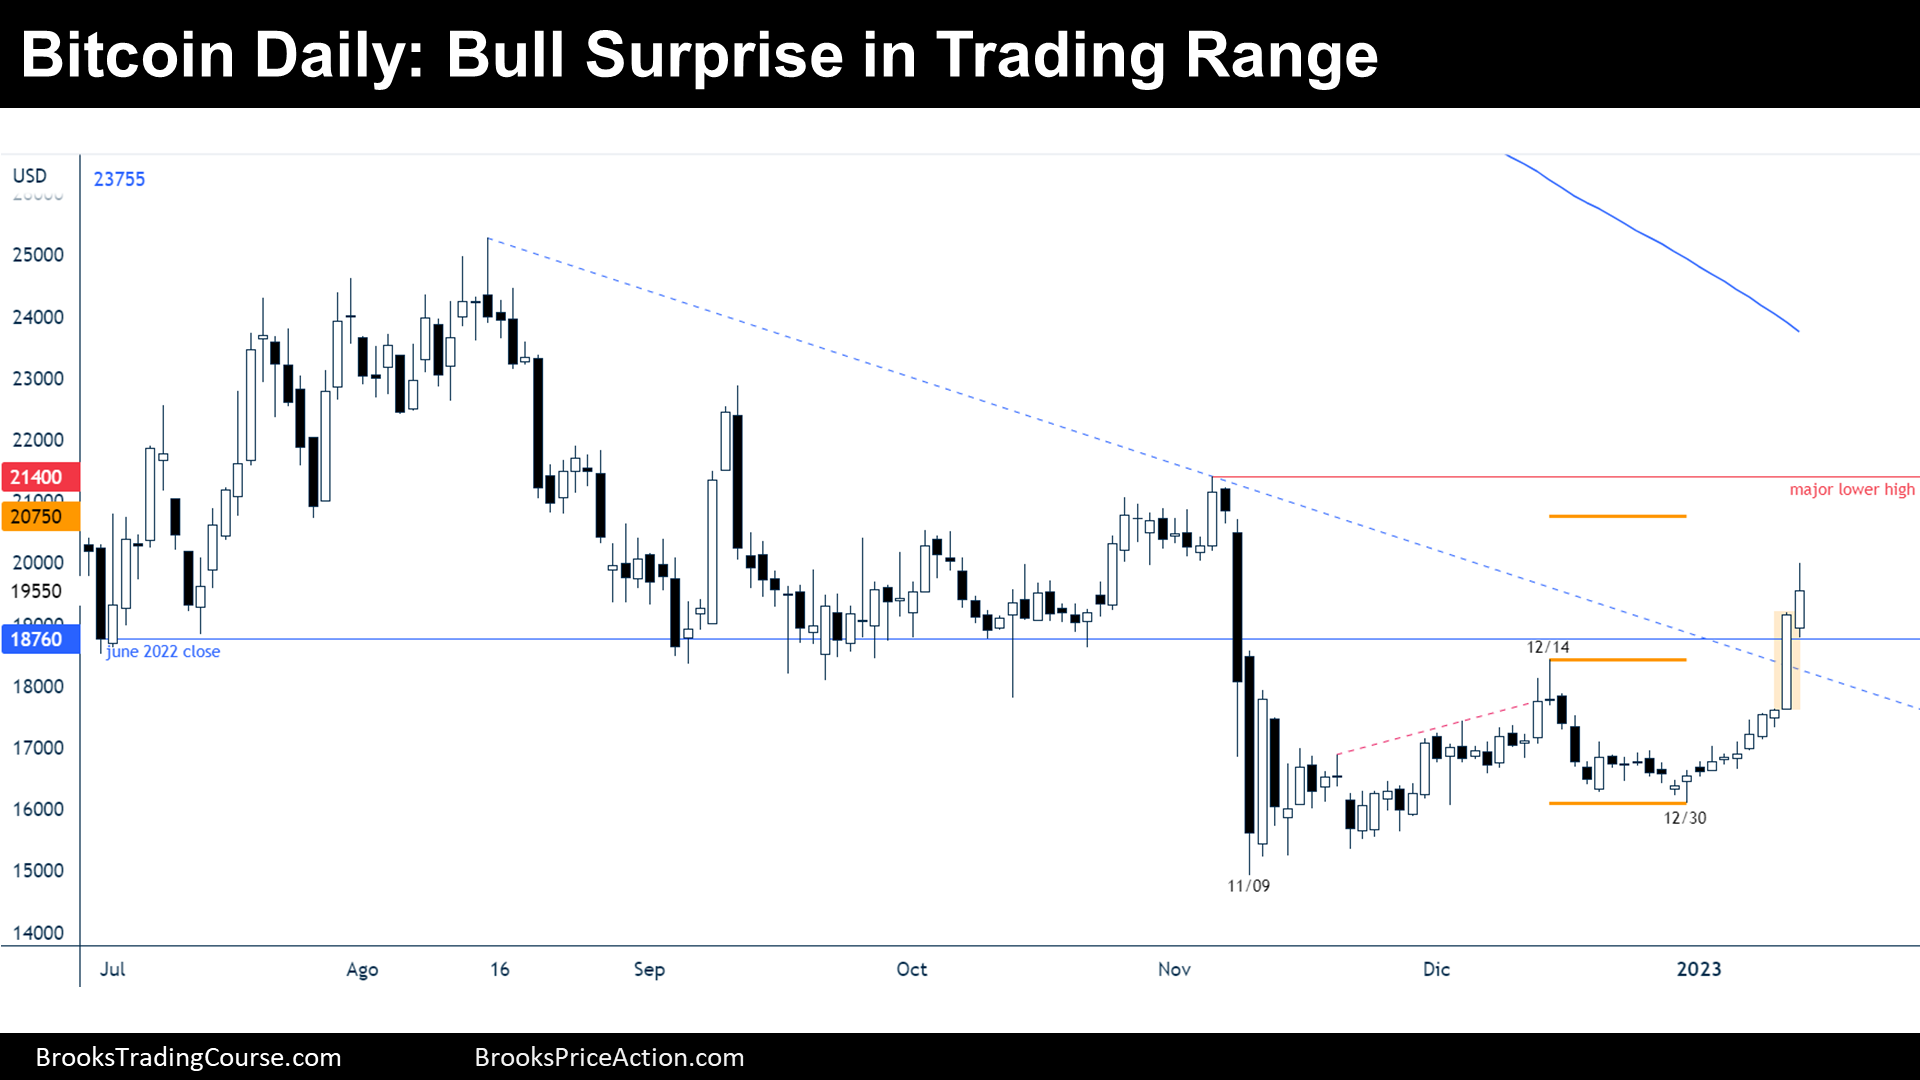
The Daily chart of Bitcoin futures

Analysis
- During the week, all bars were bull bars: the buying was relentless.
- There is a 6-bar micro channel: traders should expect a pullback starting the next 1–3 days.
- This leg is strong enough to expect another one or two legs up. Bulls are strong, they are buying at the market, they hope that this is the start of a spike and channel bull trend.
- The price is breaking above various price levels:
- 12/14 high.
- Major bear trend line.
- June 2022 close.
- On the left of the chart, there is a trading range, which represents an area of agreement. This might be just a 2-legged up move within a trading range. However, traders should expect more upside because many bears have their stop losses at the major lower high, and it is expected that this move will get there.
- There are various bullish measured moves in play; the nearest one is at $20750, and it is based upon the size of a prior bear climax. If the price gets above that level without signs of profit taking, traders might look at a measured move based on the total distance between 11/09 low and 12/14 high.
- If the price gets to the major lower high, it will technically end the bear channel. Ultimately, bulls want to get to test the 200-day simple moving average (the only moving average shown on the chart).
Trading
- Bulls:
- They think that they are in a spike and channel bull trend. After a 6-bull micro channel, they might either wait to buy a pullback, or trade small and add to their positions during a pullback: the stop loss is far away; thus, the risk is big. The chances are that the price it will get to the major lower high.
- Bears:
- Bears hope that this is just a bull climax within a trading range; hence, they will sell a micro double top or a breakout mode pattern such as an “ii”.
Market analysis reports archive
You can access all weekend reports on the Market Analysis page.

