Market Overview: Bitcoin
Following up on our previous report’s prediction, Bitcoin has indeed climbed towards a magnetic pull – the all-time high. This week not only saw the price reach that target, but it surged past to a brand-new record of $70,199. This marks the first time Bitcoin has arrived at the significant big round number level of $70,000.
Looking at the year so far, Bitcoin’s impressive performance continued, trading from $40,000 to $70,000. Definitely, the long-awaited approval and launch of the Bitcoin ETF appears to be having a positive impact on the asset interest.
The burning question that has lingered throughout 2024 reports – can Bitcoin keep climbing? — remains. This week offered no definitive answer. Will the trend continue, or will the cryptocurrency finally find equilibrium after reaching this new peak? We’ll delve deeper into this possibility, but more importantly, we will build a framework for traders.
Bitcoin
The prices depicted on our charts are sourced from Coinbase’s Exchange Spot Price. It’s crucial to note that the spot price of Bitcoin is continuously in motion; trading activity never ceases. This means that market fluctuations and price changes occur around the clock, reflecting the dynamic nature of cryptocurrency trading.
The Weekly chart of Bitcoin

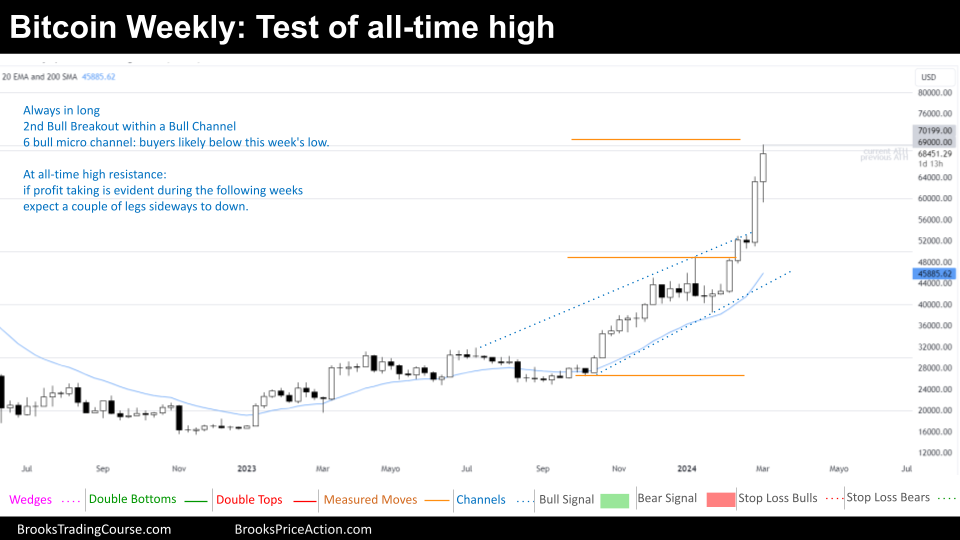
The weekly Bitcoin chart remains firmly in an Always In Long phase, indicative of a strong bullish trend. This week continued the Bull Breakout market cycle, which is either a Bull Breakout within a Bull Channel (more likely), or a Bull Breakout of a Bull Channel (less likely).
The most significant event this week was the price reaching the previous all-time high, now acting as major resistance, also around the big round number level of $70,000.
Two key possibilities emerge from this point:
- Bull Breakout Failure: Profit-taking and sellers at the resistance could lead to a price drop. However, this wouldn’t necessarily signal a bear trend. The price might enter a Trading Range/Consolidation phase before resuming the uptrend within the Bull Channel.
- Continued Bull Breakout and Tight Bull Channel: If buying pressure persists, the price could continue surging or transition into a Tight Bull Channel. Traders would likely continue buying on bull closes, below good bull bars, bear closes, during pullbacks, and at 33% or 50% retracements from the Bull Breakout or Tight Bull Channel.
The weekly chart doesn’t currently show any significant profit-taking activity. However, if this occurs, expect a temporary price dip with a couple of legs sideways to down, before a potential resumption of the uptrend.
The Daily chart of Bitcoin

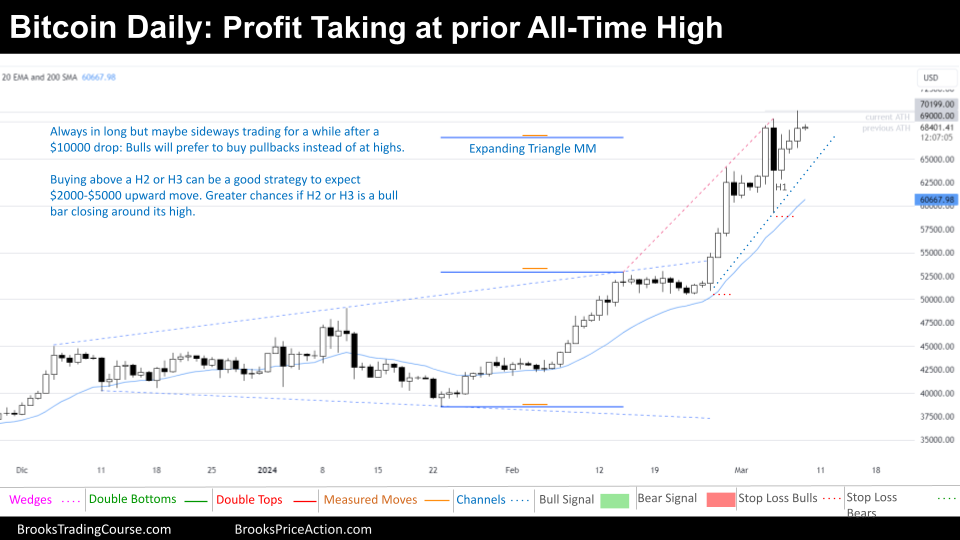
This week’s price action witnessed a shift from the previously established strong uptrend in the Daily Chart. The price initially continued its ascent within a tight bull channel, indicating weakening momentum. However, this trend abruptly reversed as the price reached a new all-time high, followed by a substantial sell-off of approximately $10,000.
This price movement aligns with our prior analysis of the monthly chart, which highlighted the potential for bearish scalping opportunities between $5,000 and $10,000 on the monthly chart.
The significant drop is likely attributable to profit-taking by traders who capitalized on the strong bull run. With the counter-trend traders already out of the picture during a pronounced uptrend, such a sell-off often signifies profit-taking behavior.
The profit-taking is expected to lead to a period of sideways trading. Bulls, who were previously driving the uptrend, are likely to adopt a cautious approach before re-entering the market. They may wait for technical confirmation signals like double bottom or wedge bottom patterns before resuming their buying activity.
Some bears might engage in short-term scalping by selling high, anticipating that bulls will exclusively buy at lower price points. Swing Bears might wait for a confirmed Always in Short, preferably after a 20-bar consolidation, before going in on short positions.
Swing Bulls are likely to be hesitant and may wait for clear bullish reversal patterns like a double bottom or a wedge bottom before re-entering the market. Scalping Bulls, however, might attempt to buy at the 20-day EMA, above a High 2 or High3 setup, particularly when accompanied by strong bullish candlesticks closing near their highs. These bulls might choose to take partial profits while maintaining a holding in case the uptrend resumes.
Overall, the market is expected to consolidate in the near term following the profit-taking. Traders should closely monitor technical indicators and price action for signals indicating the direction of the next breakout.
What are your thoughts? Share your thoughts in the comments below and let’s get a discussion going! We appreciate any insights you may have regarding the price action framework. Remember, some of the most valuable contributions come from you, so don’t hesitate to share your knowledge!
Josep Capo
Market analysis reports archive
You can access all the weekend reports on the Market Analysis page.


First of all Thanks a lot for the above (quite informative).
Given the present high volatility of the BTC, is it possible to have a daily market update, or every other day, from now till after the halving. It would be quite beneficial to get a sense of confidence in our trading.
TX 🙂