Market Overview: Bitcoin
Welcome back to the Bitcoin Report. In our last report, we cautiously eyed January’s big doji as a potential double top, raising concerns about a price reversal. However, February defied expectations with a powerful bull breakout bar, propelling the price from $40,000 to a staggering $60,000 – a remarkable +40% surge.
Now, as Bitcoin sits near its all-time highs, a crucial question lingers: will the uptrend continue its ascent, or are we due for a correction? This report delves into this critical query, leveraging price action analysis to provide a framework.
Bitcoin
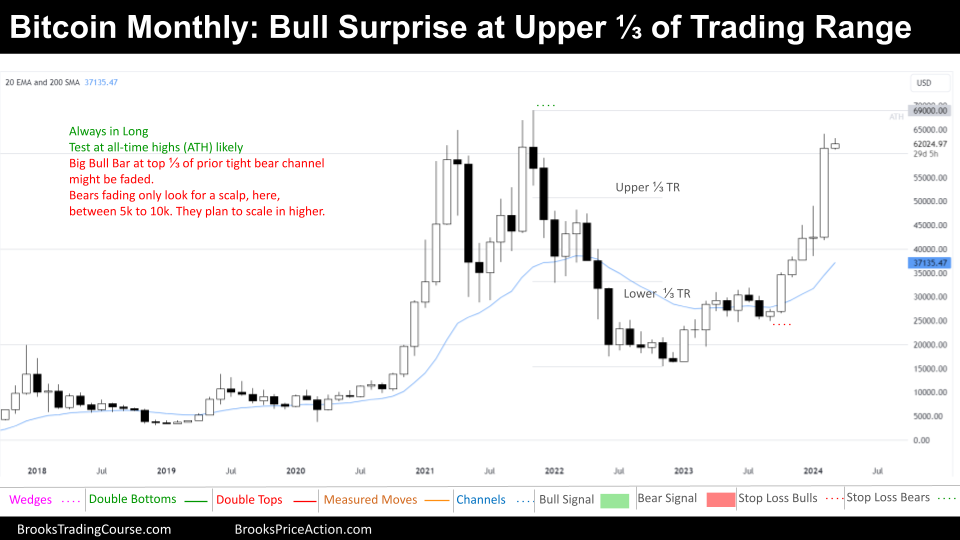
The Monthly chart of Bitcoin

The monthly chart reveals a strong bull breakout. However, the bull breakout has a tight bear channel on the left, which means that the price is within that prior price range, and hence, it the price is within a trading range. This signifies a potential continuation of the trading range dynamics rather than a trend.
The price is residing in the top third of the trading range. This position attracts sellers; however, there is still buying interest driven by the allure of reaching the all-time high magnet. The short-term sellers are just looking to scalp from a brief downward correction. These scalps might be relatively small, ranging from $5,000 to $10,000.
Bears will be willing to scale in higher, meaning they are open to selling at different points, like the all time high or at $70000. The mathematical advantage favors them at this juncture, making it potentially profitable to trap overly optimistic bulls in a “bull surprise bar” – a sudden and unexpected price reversal.
However, some bears might be hesitant to sell just yet, preferring to sell above a low 1 setup or a swing high to confirm weakness before entering short positions. This wait-and-see approach indicates a certain respect for the current bull strength.
On the other hand, bulls face an unfavorable equation. Buying at these elevated levels requires risking significant capital for potentially smaller gains. This scenario discourages many swing bulls, who would ideally wait for sideways consolidation or a higher low for a more favorable entry point.
Finally, it’s crucial to remember the trapped bears lingering around the $40,000 mark – the 50% pullback point of the previous bear channel. These sellers anticipated reasonably a downward correction at this level.
In conclusion, the current Bitcoin market structure presents a complex challenge for both bulls and bears. While a bull breakout has occurred, it remains confined within a larger trading range, suggesting potential range-bound continuation rather than a clear trend. The price residing near the all-time high attracts both buyers and short-term sellers, while bears strategically “scale-in” to capitalize on any potential weakness. Ultimately, the coming weeks will reveal whether the bulls can sustain the momentum.
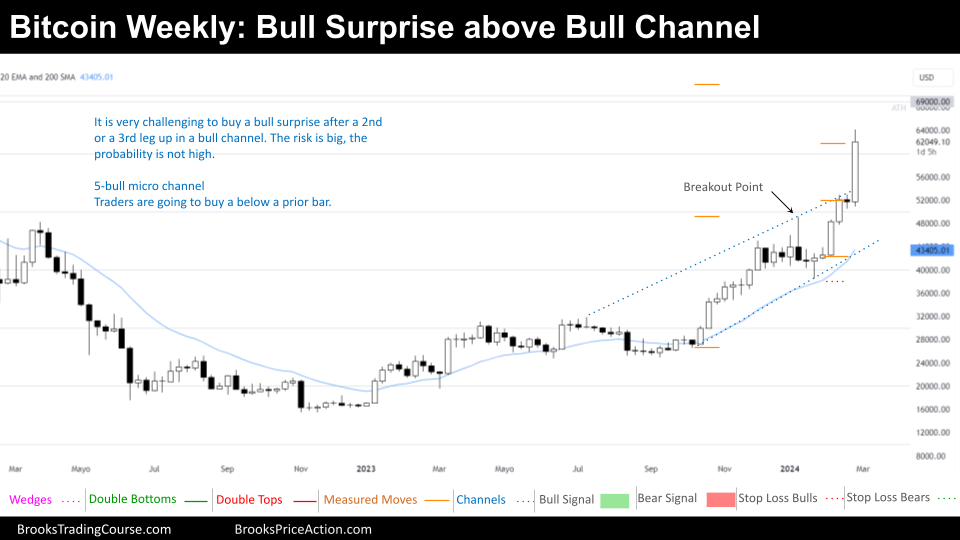
The Weekly chart of Bitcoin

The Bitcoin weekly chart this week showcases a bull breakout, the largest yet visible on the chart. This surge propels the price well above the established bull channel. However, despite the bullish appearance, several factors cast a shadow of uncertainty on the sustainability of this breakout.
Statistically, only 25% of bull breakouts above bull channels succeed. This low success rate raises concerns about the long-term validity of the current upward move. Traders anticipate a reversal into the bull channel within 1–5 bars, potentially leading to a trading range formation.
Furthermore, buying now is considered risky. The lack of sideways consolidation or a downward correction do not offer bull entry points with favorable risk-reward ratios. Swing traders, particularly those positioned on the bearish side, are likely to wait for a trading range to develop and then wait for a double top or wedge top pattern before considering short positions.
Despite the concerns, the bullish narrative remains present. The sheer size of the breakout bar cannot be ignored, and it might signal a continuation of the uptrend. However, the low historical success rate and the absence of confirmation through sideways consolidation urge caution.
In conclusion, while the bull breakout is visually impressive, its statistical weakness and the lack of confirmation raise questions about its sustainability. The coming weeks will be crucial in determining whether the bulls can maintain momentum, or if the price returns, as it is expected, into the bull channel.
Market analysis reports archive
You can access all weekend reports on the Market Analysis page.

