Market Overview: Bitcoin Futures
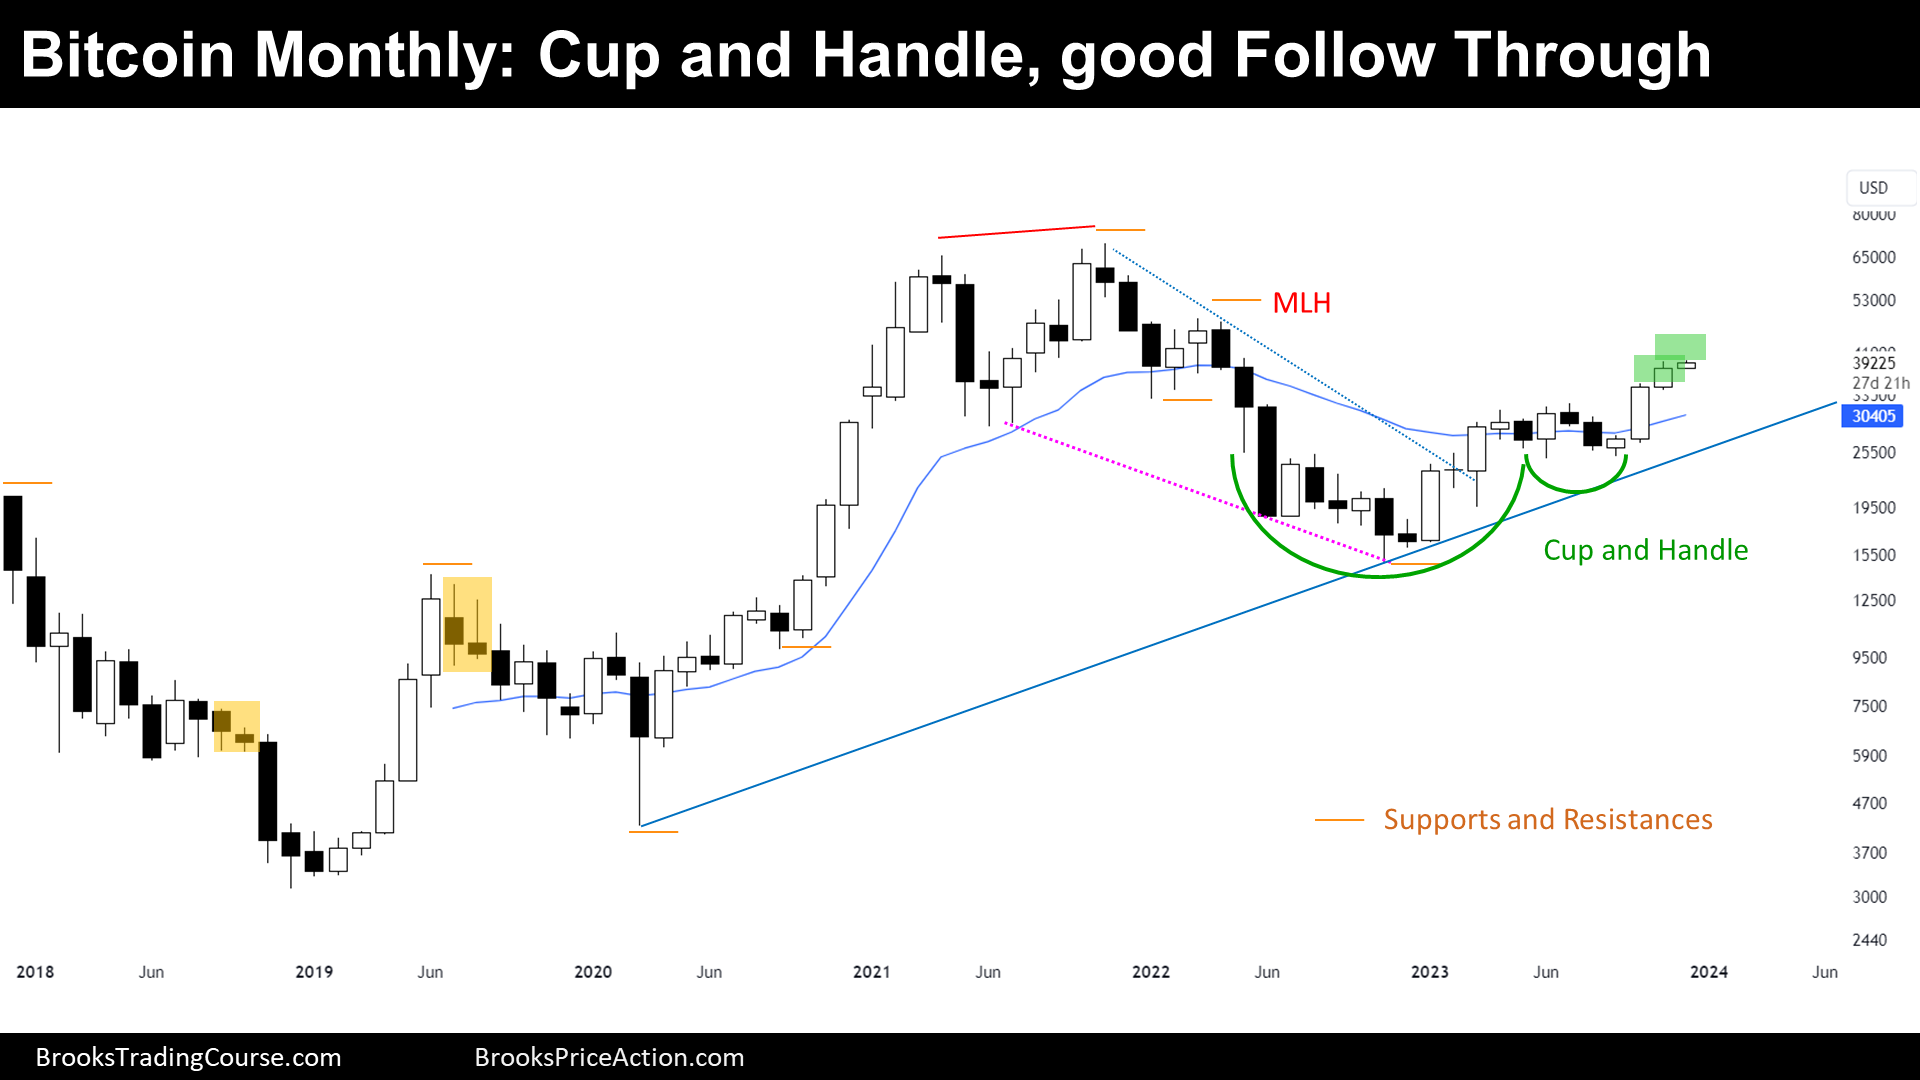
Bitcoin’s monthly chart: The price created a good follow through bull bar in November, after the Buy Signal Bar of October, that was Breaking Up a Tight Trading Range. During November, the price increased its value by 9.40% respecting the past month’s close. Now, after the Cup and Handle Bull Breakout and the good Follow Through, Bulls think that this is a Major Trend Reversal and a Small Pullback Bull Trend.
But remember that since last year, we have been saying that the price is probably within a Trading Range. Not a Bear Trend (we have said it when was falling hard) and probably not a Bull Trend (nowadays). This assumption is because Bears were strong around the prices that the price is visiting now: Traders expect, at least, another leg sideways to down.
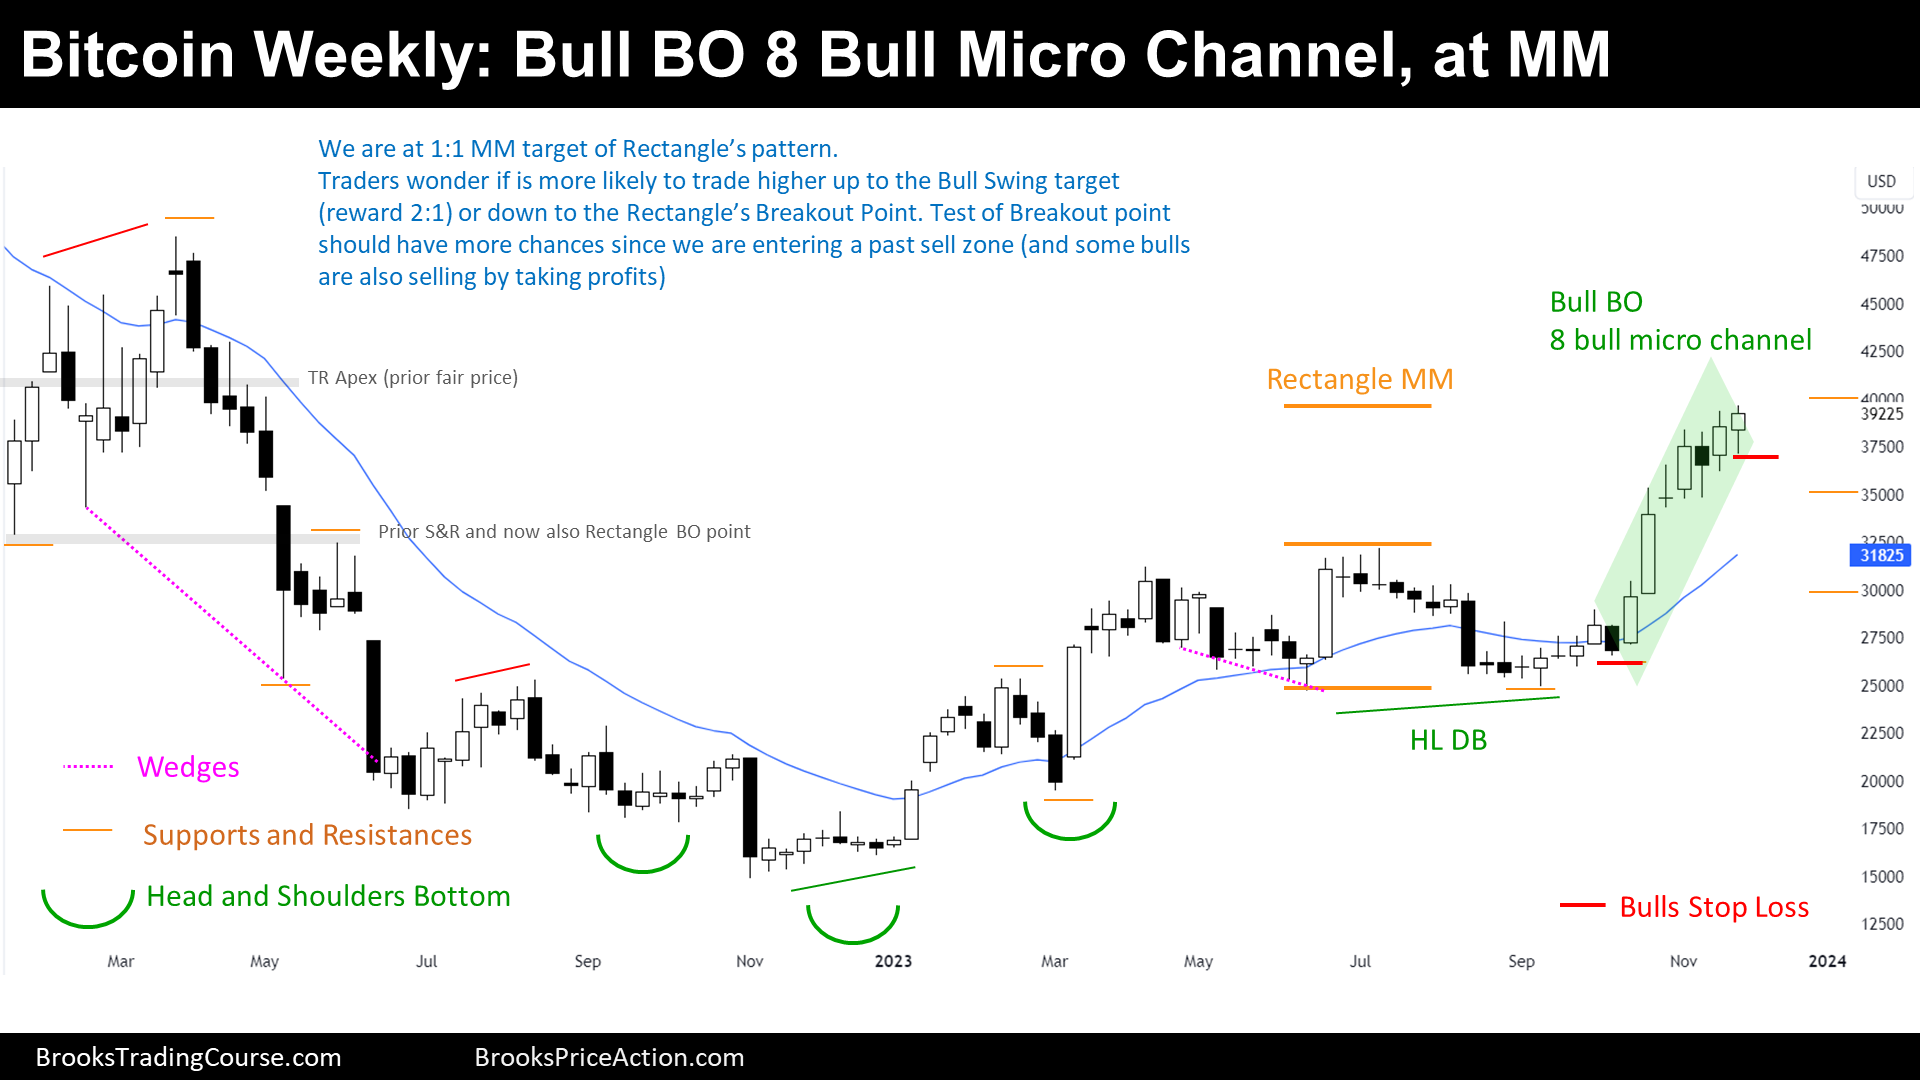
Regarding the Weekly chart, last week we have said that the price was likely to test the middle point of November during this week. Indeed, this week, the price traded almost all the way down until there, but it failed, denoting bull strength.
Bitcoin futures
The Monthly chart of Bitcoin futures

Past: Supports and Resistances
- Bitcoin did a strong bull breakout of a Trading Range that lasted from 2017 until 2020.
- 2017s high.
- 2019s high.
- Bull Breakout Low (Major Higher Low).
- Three consecutive Bull Breakout Bars breaking out strong resistance create a buy zone.
- Then, the price did a Double top and broke down a minor higher low:
- All-time high.
- Major Lower High.
- Minor Higher Low (June 2021 Low) is a Breakout Point.
- Thereafter, the price created a wedge bottom and bull flag that couldn’t break support, did not reach the Major Higher Low, and ended reversing up:
- 2022 Low.
- Also, the price did a micro double top, and after reversing up from a bear signal bar, created a micro double bottom.
- Tight Trading Range (TTR), which is also a Breakout Mode Pattern (BOM).
- Finally, the price broke the BOM to the upside, creating a Bull Breakout of a Cup and Handle Pattern:
- TTR Breakout Point.
- Major Higher Low.
Present: Market Cycle
- The main market cycle is more likely a Trading Range than a Small Pullback Bull Trend.
- Traders won’t deny the possibility of this being a successful Major Trend Reversal, they will Trade what they see and not what they think. If the price gives Bull Signals, they will buy.
Future: Inertia
- 2022 was a Tight Bear Channel, and Tight Bears Channels create sell zones.
- Traders expect, at least, another leg down surging from current prices or around the Major Lower High.
- However, the price did a good Buy Signal Bar in November, and this means that even if there is a reversal down, the price will likely test this month’s high.
Trading
November is a Good Follow Through Bar of October’s Buy Signal. Hence, Bears did not get what they wanted: a Failed Bull Breakout BOM.
- Bulls:
- They bought the BOM pattern.
- Their Stop Loss is below the BOM pattern or below September’s low. ‘
- Their Target is to get to the Major Lower High (MLH).
- Bears:
- November is a Good Follow Through Bar of October’s Buy Signal. Hence, the Bears did not get what they wanted: a Failed Bull Breakout BOM.
The Weekly chart of Bitcoin futures

Past: Support and Resistances
- The price started a Strong Bear Channel:
- Bear Flag’s Breakout Point (now rectangle’s Breakout Point).
- Major Lower High.
- Trading Range Apex (prior fair price).
- Then, failed a Breakout Below a Bear Flag and Reversed up, forming a HSB (Head and Shoulder Bottom) pattern, that broke up:
- 2022 Low.
- 2022s Major Higher Low.
- 2023 Major Higher Low.
- HSB Breakout Point
- HSB Measured Move around $35750 already reached.
- 50% Pull Back at around $42000, from all-time high to 2022 low.
- Lately, the price has been sideways creating a Double Top and a Double Bottom, which is a Trading Range, and because the Trading Range was not wide, was also a Rectangle and Breakout Mode Pattern.
- Trading Range High (Rectangle’s Breakout Point).
- Trading Range Low.
- Measured Move at $39500.
Present: Market Cycle
- The price is probably in a broad Trading Range instead of a strong bull trend, this is because on the left of the chart there were sellers and hence, exist sell zones.
Future: Inertia
- The price will likely reverse soon, maybe after reaching the $40000 area.
- Then, it will incite weak bears to sell by pulling back, but the first reversal down will likely be bought, even if it reaches the major higher low.
- If it keeps trading higher, might reach the 2022 high, but if this is a Trading Range, it will struggle to break up resistances like $40000 and $42000 (50% Pull Back from all-time high to 2022 low).
Trading
There are more sellers than buyers below this week’s low, if the price goes there, probably will test the Rectangle’s Breakout Point or $35000. Looking to buy below $30000 and sell above $40000 it remains the plan for most swing Traders.
- This week’s candlestick is a bull reversal bar, not a bad buy signal bar for bulls, but since the price just reached a Measured Move and it is right below $40000 big round number, maybe bulls should be cautious.
- Bulls:
- For Bulls that bought during the Bull Breakout or with a Stop order above the pattern (call it Rectangle or Breakout Mode Pattern):
- Many will exit below this week’s low.
- Others want to keep the stop loss at the breakout’s low.
- Good risk management can be taking partial profits and move the stop loss to the entry point, or below this week’s low.
- Bears:
- For now, they do not have any available setup (but selling with limit orders around $40000 targeting $24000 area, stop loss at 2022 high).
Market analysis reports archive
You can access all the weekend reports on the Market Analysis page.

