Market Overview: Bitcoin Futures
Bitcoin futures trading sideways during the week. The final flag bull setup triggered a few weeks ago still in play while the price is within a bear channel.
Bitcoin futures
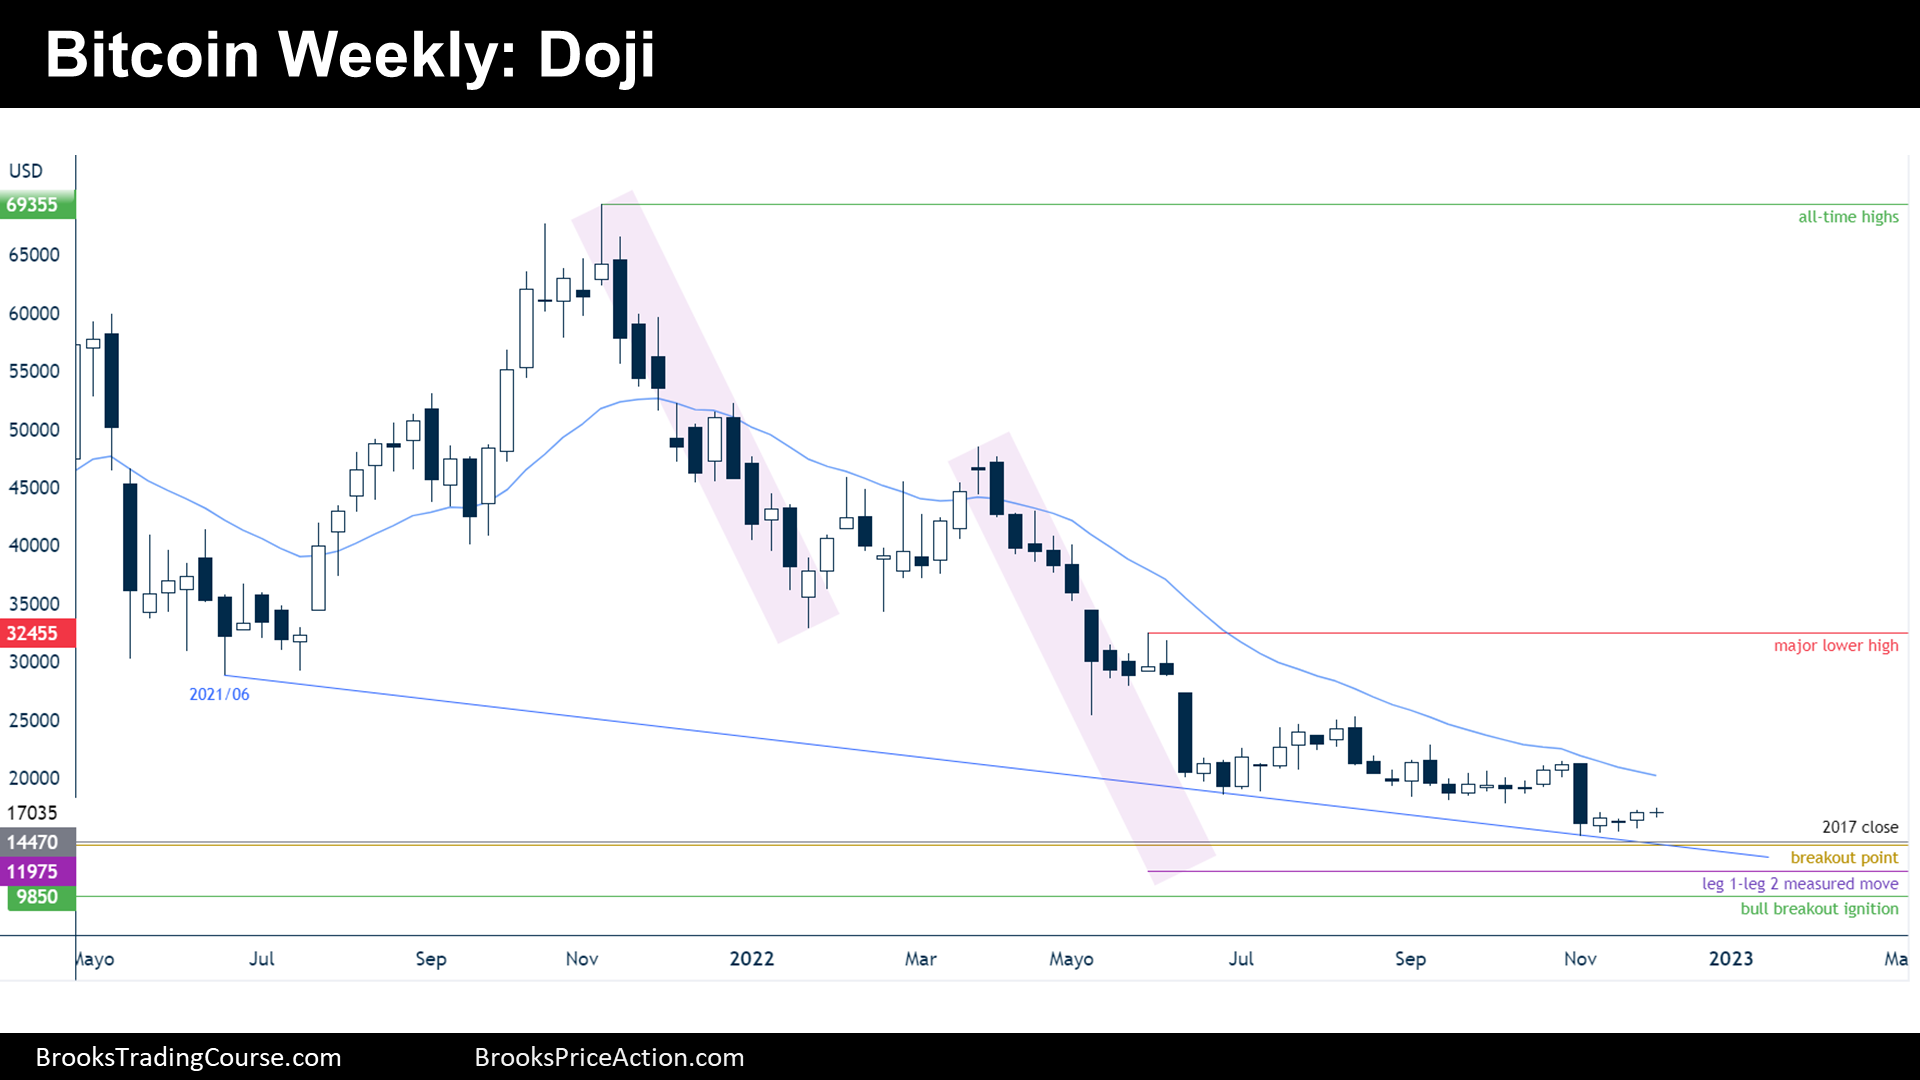
The Weekly chart of Bitcoin futures

- Bitcoin futures trading sideways with weekly candlestick a doji bar. The doji bar comes after a good bull follow through bar of a final flag of a bull setup.
- For the bulls, it is a weak bull setup. For the bears, it is a Low 1 in a bear trend.
- We have been saying during prior reports that the price has major price levels below, hence, supports.
- The bear trend has been weakening during the past 6 months. Because this is happening after two major bear legs, traders expect a bull leg coming soon, testing the June 2021 low, where, as we have repeatedly said, there are trapped bulls. Those bulls will add strong selling pressure during any serious attempt at reversing the bear trend.
- While the price is above the major bull breakout ignition at $9850, traders think that the long-term bull trend is technically valid.
- For the following weeks, the bears want a new low of the year. If they succeed, the final flag bull setup currently governing the price action will be obsolete.
- The bulls want a bull leg to at least the June 2021 low. More likely, they might get a test of the apex of the final flag or the 20-week exponential moving average.
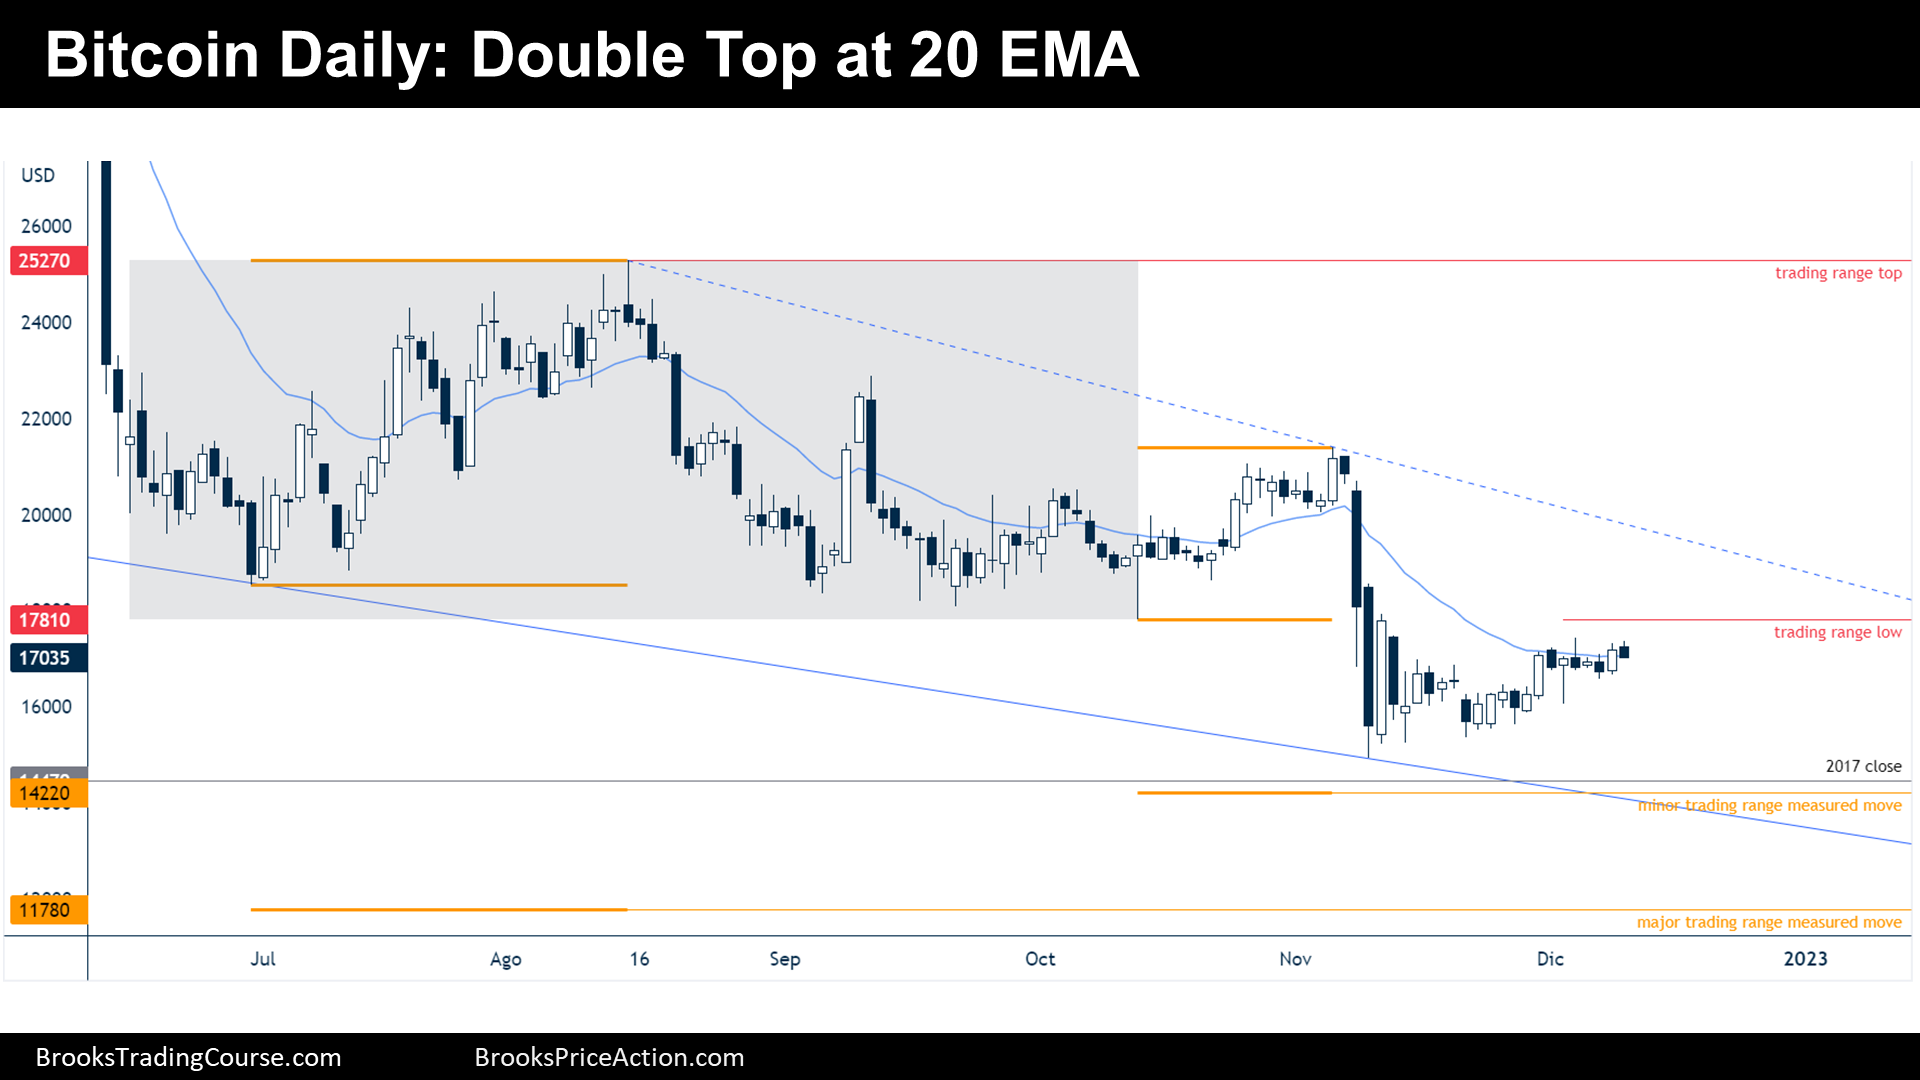
The Daily chart of Bitcoin futures

- During the week, the price formed a double top at the 20-day EMA (exponential moving average). Friday is a bear sell signal setup, a failed High 2 bull flag at resistances: range’s breakout point & 20-day EMA.
- The bulls think that the price is already within a bull channel because bears failed more than 4 times to reverse the bull trend (Low 4). They hope that we are within a small pullback bull trend.
- However, many bulls will exit below the sell signal setup, they do not ignore fact that the bull reversal traded mostly sideways. Others will trust their stop loss below the low of the year.
- For bears, it might be a good idea to sell expecting to achieve at least their minimum target at $14220, which corresponds the minor trading range measured move.
- Bears see a bear flag within a broad bear channel, and they might sell a rally, but the bear channel has been weak, and moreover, it has already more than two legs down: it might be exhausted.
- The best traders should expect, until they see conviction, is trading range trading. It is true that there is a small bull trend that has begun within a major buy zone area, but there are no strong bull bars yet. Neither can traders call this bear channel technically over.
- If Monday is a good follow-through bar for the bears, there might be a test of the year lows underway. More likely, traders should expect Bitcoin futures trading sideways for the following days, at least until the release of Consumer Price Index numbers coming on Tuesday.
Market analysis reports archive
You can access all weekend reports on the Market Analysis page.


thanks for your report. I don’t see any indication of trapped bulls in July 2021 (I think they have exited by Jan 22). Weekly trend is still down with no indication of an upturn. Low target being 12,460 to a final leg 3 low.
Daily is SW with no real indication of what might happen. Yes true fri was a failed H2 but in a SW market it means little.
I suggest the best chart here is the Monthly which to me indicates that leg 3 bear is still forming and might spike down to 12k to 9.5k
Hola Tom C! Thank you very much for your comment and for your nice price action insights!
I think that there are trapped bulls below June 2021 because thereafter, it created a higher low (Sep 2021 low) up to all-time highs. Therefore, it was reasonable for traders to place a limit order at the low of June 2021, betting that, that price was near the low of a trading range; hence, it is not possible that bulls exited on January 2022 because that limit order buys were not filled until May 2022. Resuming, I think there are trapped bulls there because it was a reasonable thing to do. After a strong bull trend, a trading range is more likely than a bear trend.
Fully agree on what is going on within weekly and daily charts.
About the 3rd leg that you expect, it might happen, but I think that a 3rd leg it is not a must. Normally, it takes 2, 3 or 4 failed attempts to reverse a trend (more than that it could mean that we are within an opposite trend). Considering that the price sits above crucial supports and that the bear trend presents signs of exhaustion, I think that a 3rd leg down to around 10k it is not the most likely outcome, that the 3rd leg might already happened or that we are not far from the bottom of that 3rd leg. Of course, as I have stated many times, it is possible because the bearish inertia on the medium to short-term timeframes it is not over yet, technically, and the long-term major bull trend it can be stopped by trading at $9850.
Wishing you a lovely week ahead.
Josep