Market Overview: Bitcoin Futures
Bitcoin failing bear breakout and stalling at Major Support. Short-term Bulls regained control after 3 months watching a Bearish price concert. Traders expect the price to pullback to $30000 before the end of this current Quarter.
Bitcoin futures
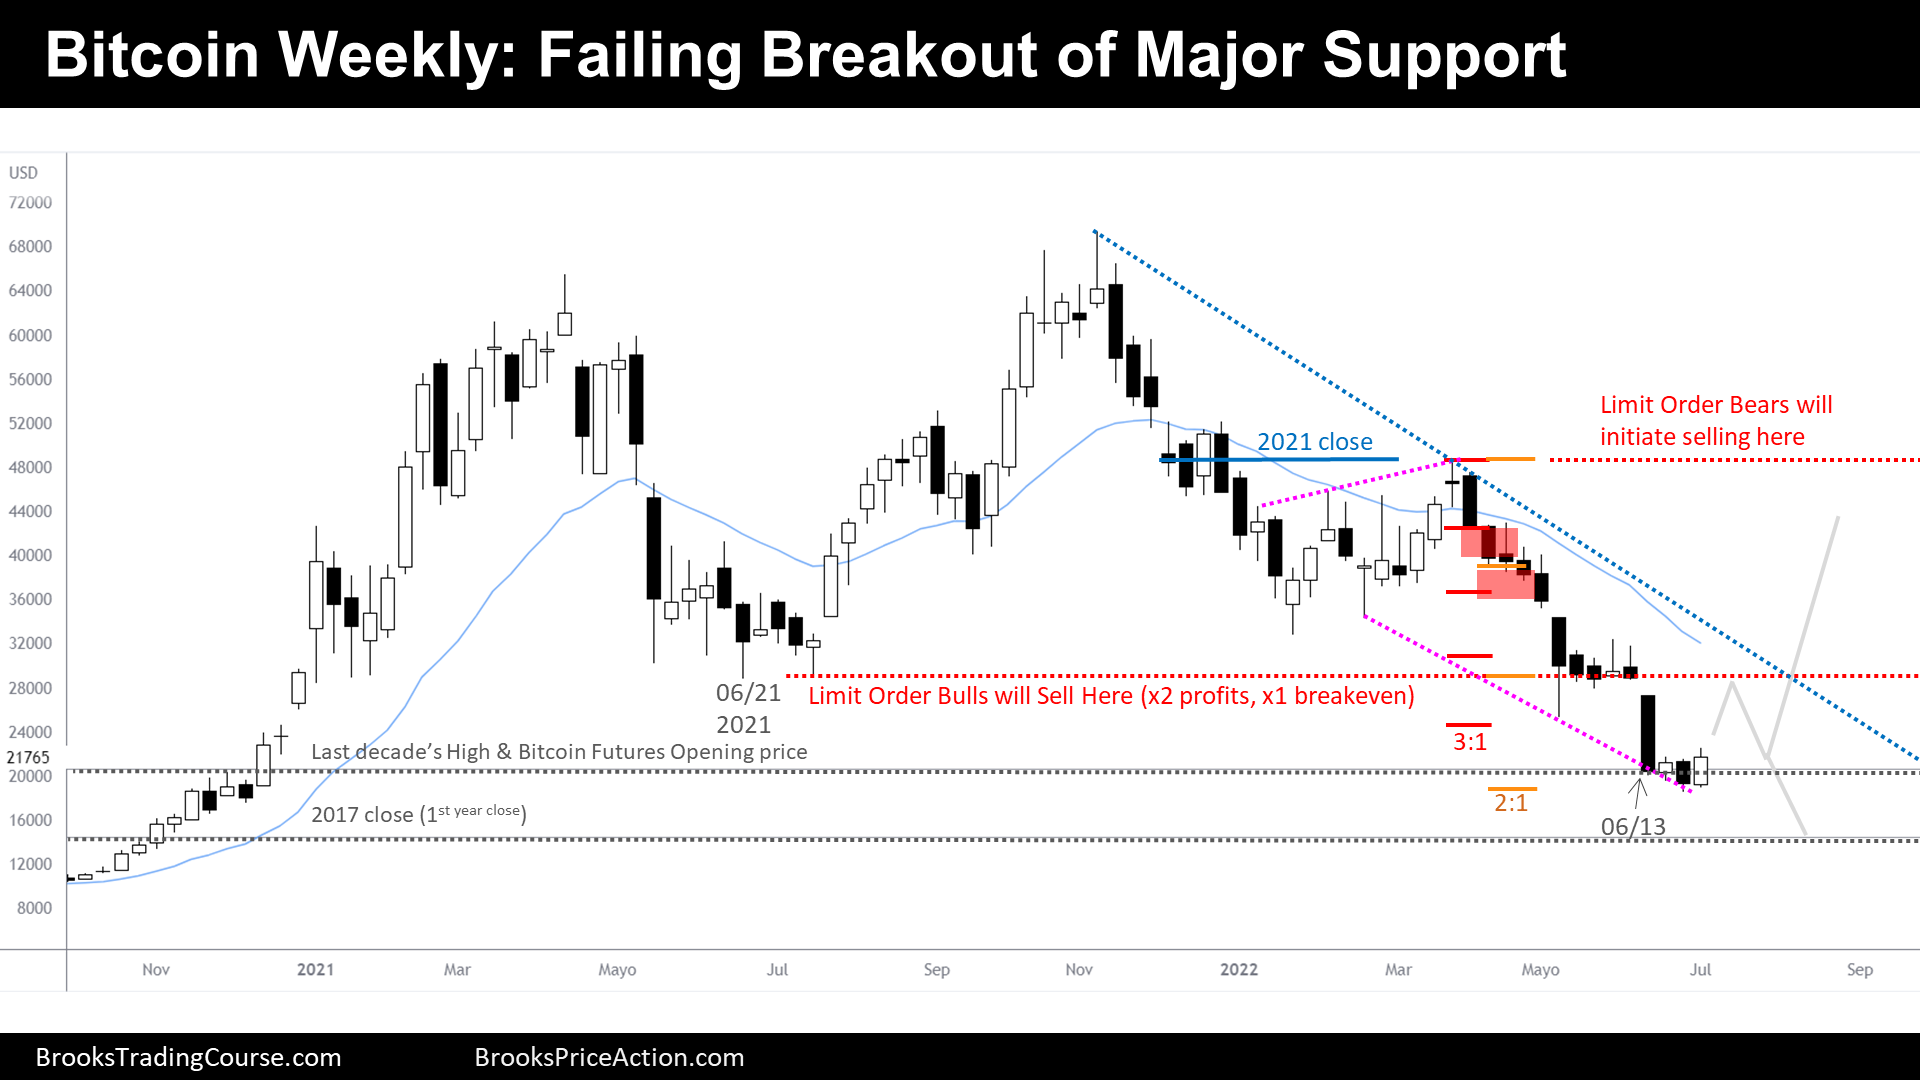
The Weekly chart of Bitcoin futures

Context
- This week we had a bull bar closing above last week’s high.
- This may be a failed breakout below a Major Support, the prior all-time highs, which also is the price of the Open when Bitcoin Futures were launched.
- On the prior report, we have said that last week’s bear bar, instead of being a continuation of the trend until 2017’s close, might just be a small 2nd leg down that we typically we see after a strong bear leg.
- Is this the start of the pullback that we were anticipating?
Participants positioning exercise
- On prior reports we have talked about how, generally, market participants are positioned, positioning, or willing to position in the markets:
- We have said that Swing Traders (trend/stop order traders) generally scale out their positions in 3 portions. The 1st one at 1:1, the 2nd one at 2:1 and the 3rd one at 3:1.
- Note that when it is evident that they have reached the 2:1, there is not much fuel or energy for a trend to continue (only 1/3 of fuel/energy remains).
- In real time, it is sometimes hard to recognize good swing/stop entries, it is easier to recognize them after they have had good Follow Through; Well, we missed that trade… yet, we can use that information that it is clear for us now to know what that the Traders who entered at the right place (earlier stop entries of a trend), will do at certain price targets.
- While I’m doing this exercise, I prefer to assume that Swing Traders only enter the market at best prices, that is, at the beginning of any trend, not later. This is certainly not true, there are Swing Traders that enter during later stages of a trend, but won’t probably go for 2:1 or 3:1 and will be happy to take a 1:1. To make things easy, I just look at the one’s who positioned around the best prices, as they are the ones who dominate most trends.
- We have said that Swing Traders (trend/stop order traders) generally scale out their positions in 3 portions. The 1st one at 1:1, the 2nd one at 2:1 and the 3rd one at 3:1.
- As we can see on the chart, there are two clear bear stop entries at the beginning of this bear trend.
- 1st and earliest bear entry: Traders who took that entry are gone because the price already reached their targets.
- 2nd entry: They scaled out 2 of their 3 portions of their trade.
- As 1st entry traders scaled out 3/3 (all) of their trade, if we sum to that the 2/3 of 2nd entry traders, we can suspect that there is only a 1/6th of the energy that contributed to this bear trend remaining.
- Another detail, 2nd entry bears now have their Stop Loss at the prior Lower High, which is around the location of the 20 EMA and also around their 1:1.
- What about Swing Bulls?
- They think that there is a failed Breakout below a major support, and they know that Swing Bears are mostly gone. But they have a problem: Limit Order Bulls are going to sell a hypothetical reversal.
- Limit Order Bulls initiated their position below 06/21/2021 and already scaled in all their position (a total of 3 portions), they continued buying every $5000 loss in price.
- Limit Order Bulls will probably sell a lot around their 1st entry. This will provoke, likely, a leg down. Maybe with a new low testing 2017’s close (and creating a pretty harmonic wedge bottom), or perhaps it will hold above the current year low.
- I think Swing Bulls will wait; they will have a much greater chance of a significant swing up after Limit Order Bulls disappear from the scene.
- Limit Order Bears and Swing Bears are willing to sell around the same prices (prior Lower High).
Conclusion
- With the current price structure, even if the trend down continues, there will be a reversal at some point in the near future. There are no sellers, only Limit Order Bulls can sell if they decide to get out accepting a loss, very unlikely with current information.
- Limit Order Bulls will become big sellers around $30000, limiting a hypothetical reversal up.
- After Limit Order Bulls exit at their 1st entry price, Swing Bulls will have a chance during a few months to try to dominate the price structure and test 2021’s close before this year ends.
- If Swing Bulls end up succeeding, they will take profits around where Swing and Limit order Bears are willing to sell.
- Personally, I think there is a good chance that we will see the price above $35000 again this year (see more on the following Daily Report). But I also think (as we have seen in the prior Report) that this major Drawdown may not be over. Even if we were to see the price back to $50000, I think that we will, at least attempt, to test the 2017’s close at some point during the upcoming years.
The Daily chart of Bitcoin futures

Context
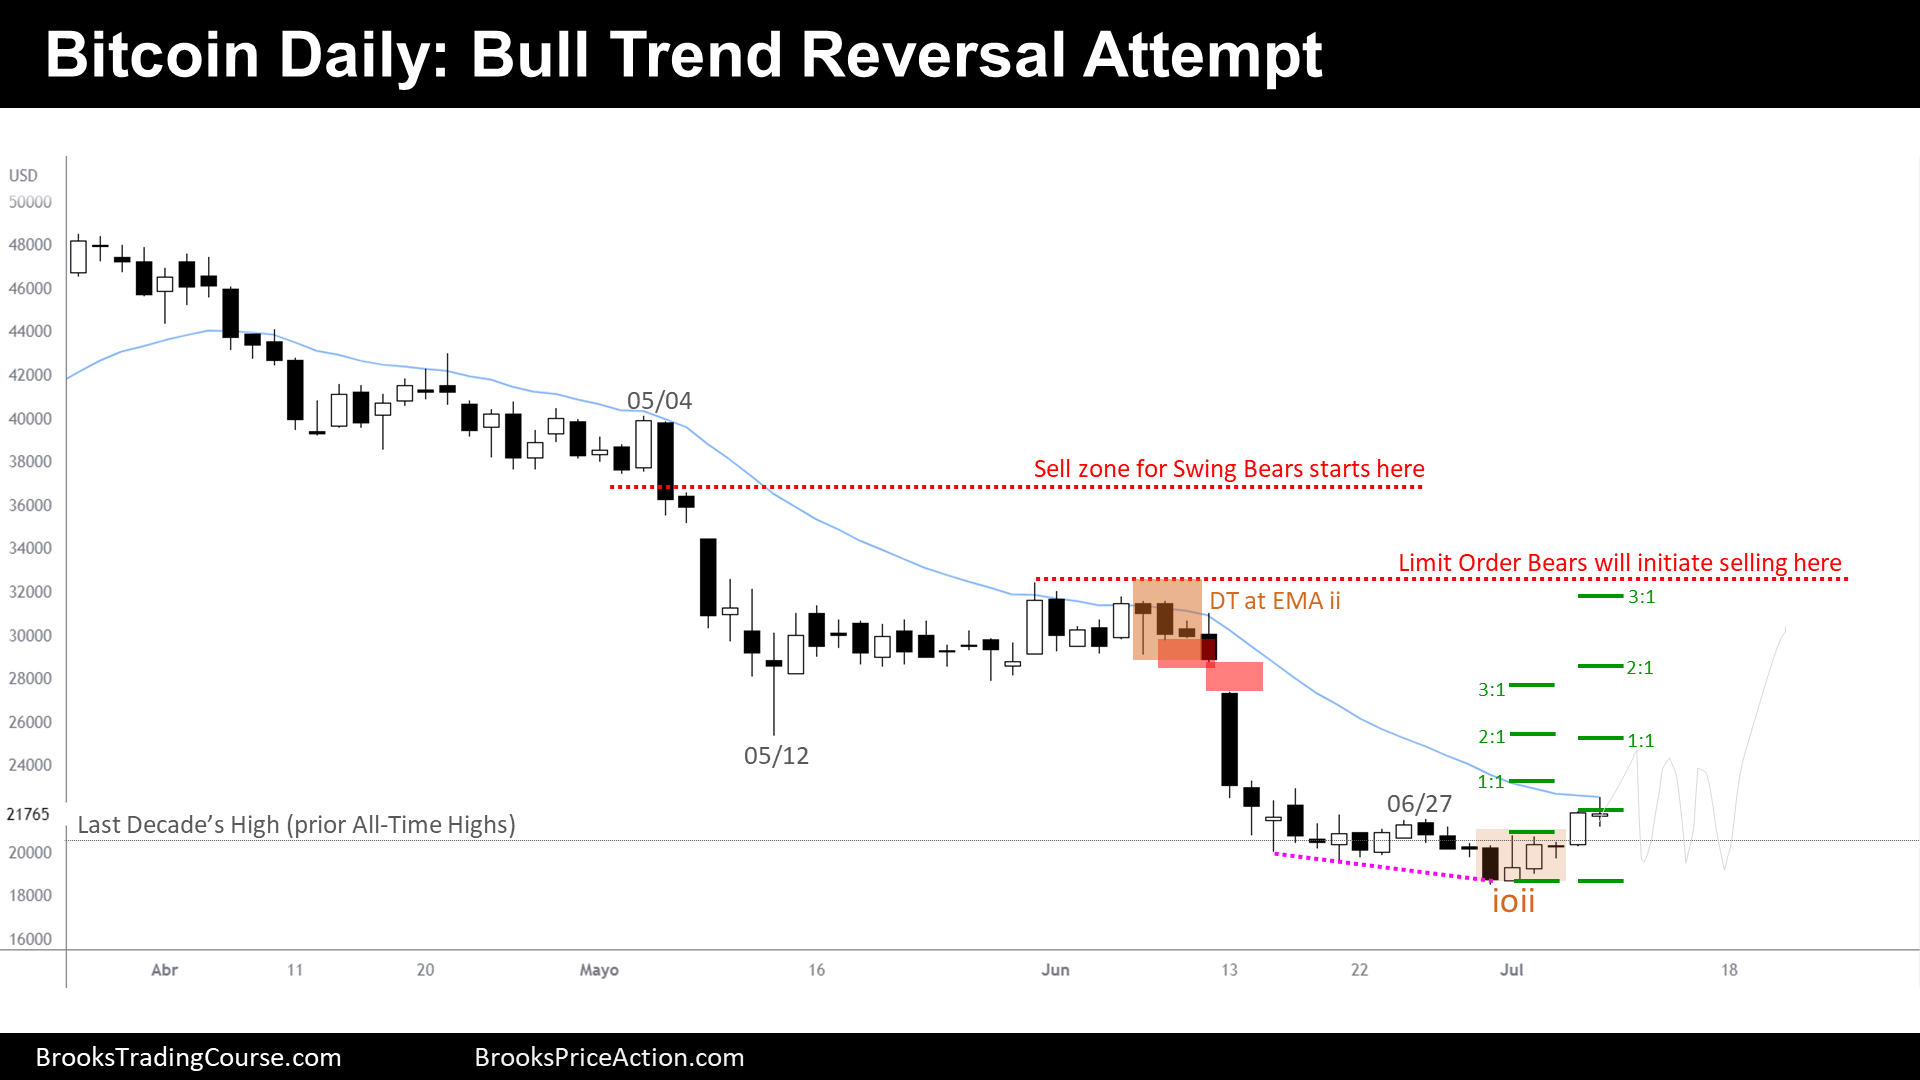
- During the week, Swing Bulls triggered an ii (ioii) buy setup that followed a wedge bottom. Good context.
- If the Bulls fail to break above the 20-period EMA, there could be perfectly a continuation of the trend down.
- But until we do not see recent Swing Bull setups failing, we must focus on the upside.
Market participants
- Bear Trend Swing Bears probably are gone. 1st bear entry reached all their targets. 2nd bear entry reached 2/3 of their targets, but they might trail their Price Action Stop to above 06/27 Lower High; however, I doubt that we can consider the 06/27 as a Major Lower High as ended up failing the breakout of new lows; I rather assume that they have a 1/6th of their selling energy in the market, or that the follow-through bar following the ii setup were those 1/6th giving up.
- Limit Order Bulls: As prior bull reversal from the Lower Low 05/12 did not trade above 05/04 Major Lower High, Major Limit Order Bulls did NOT initiate buys below 05/12.
- Note that a few weeks ago I thought, erroneously, that this was the case.
- Limit Order Bears: They know the best math now is to sell above the prior Major Lower High.
- Swing Bulls or Stop Entry Bulls: They have a great opportunity to reach their targets. The optimal bull swing setups happen when no participants are selling below their swing targets. That is the case here.
Some takes
- After forceful and well-constructed bear trends, normally, the bull first reversal emerges weak.
- Traders should not expect a strong bull reversal around current prices. They should expect a weak reversal at the beginning of it, and to accelerate up during a hypothetical 2nd leg up. Traders expect this hypothetical bull leg to end up being a bull leg in a Trading Range and not the start of a Major Trend Reversal.
- Weak Swing Bears are trying to now sell the 20-period EMA & the Top of the Bear Channel. They will also attempt to sell every topping pattern. They are recognizing that doing this, Bears made money.
- What Weak Swing Bears ignore is that that Strong Swing Bears took nice profits already, and therefore, they are not going to sell immediately right after. There is a 60% chance that before any Bear Swing Setup succeeds, their Stop Loss at the prior Major Lower High gets hit.
Market analysis reports archive
You can access all weekend reports on the Market Analysis page.


Thanks Josep for another great and detailed report! To me Bitcoin for all practical purpose is an undefined Crypto SPDR and it behave in a similar way to what the market (s&p500) is doing to the extreme in both direction. The similarity behave on the weekly chart can’t be ignore. Al constantly emphasis the TR on the S&P-500 as of July 2021 and this is more or less the case with Bitcoin. If you look on higher TF such as quarterly and yearly, the bullishness picture cant be ignored.
Hi Eli! Thank you for the feedback :), I read your questions or insights along the different reports and learn from it, as well it benefits the other disciples, so thank you for being this active on the blog.
Excellent observation. I mean, I would never take a decision based upon what I think about other correlated charts, for several reasons. But it is true that my road map for the Emini is pretty similar on Monthly Chart (likewise on weekly and daily charts): Trading Range, looking to end the year around the upper half of the Range or highs, and I also think we have not yet seen the final low of this Major Trading Range.
Furthermore, on the daily chart, the Emini and Bitcoin are both free of Limit Order Bulls (limiting upside), meaning that they have a clean move to their next resistance (4200 on Emini). There is a difference here: The bear trend in Bitcoin (and also in a slighter way on NQ) was more constructive for the Bears than the Emini one; therefore, I suppose that the move upwards will be less choppy on the Emini (smaller pullbacks, easier new highs over previous bars, etc.).
Another detail regarding the Sell Zone for Swing Traders on the Weekly Charts: The Emini Sell Zone is proximate to All-time Highs, not on Bitcoin neither the NQ. One good strategy if we get there it could be to buy the Emini and sell the NQ because we can see that the Emini chart is having more resilience on this environment.
Finally, regarding the Quarterly and Yearly charts on the Indexes, I, personally, like to look at them in real terms (by dividing the Index with the CPI (Consumer Price Index) or the PCE (Personal Consumption Expenditures), for example). This way, I think, we have a better landscape of where are the true optimal buy zones for long-term investments without ignoring the wealth illusion created by Central Banks.
Have a lovely week ahead, Eli! 😀
Could be 2leg bear trap but down so strongly, more likely a continuation of the bear trend. $13.8k remains strong magnet below.
Hi Erik, thank you so much for giving us your view again!
It would not surprise me to get there directly where you are pointing. But, to be consistent with what I said on the Report, I think there is first a 60% that we get to 30k and 40% to 14.5k (2017 close) that is around the price you suggest.
I wish you a beautiful week ahead, Erik