Market Overview: Bitcoin Futures
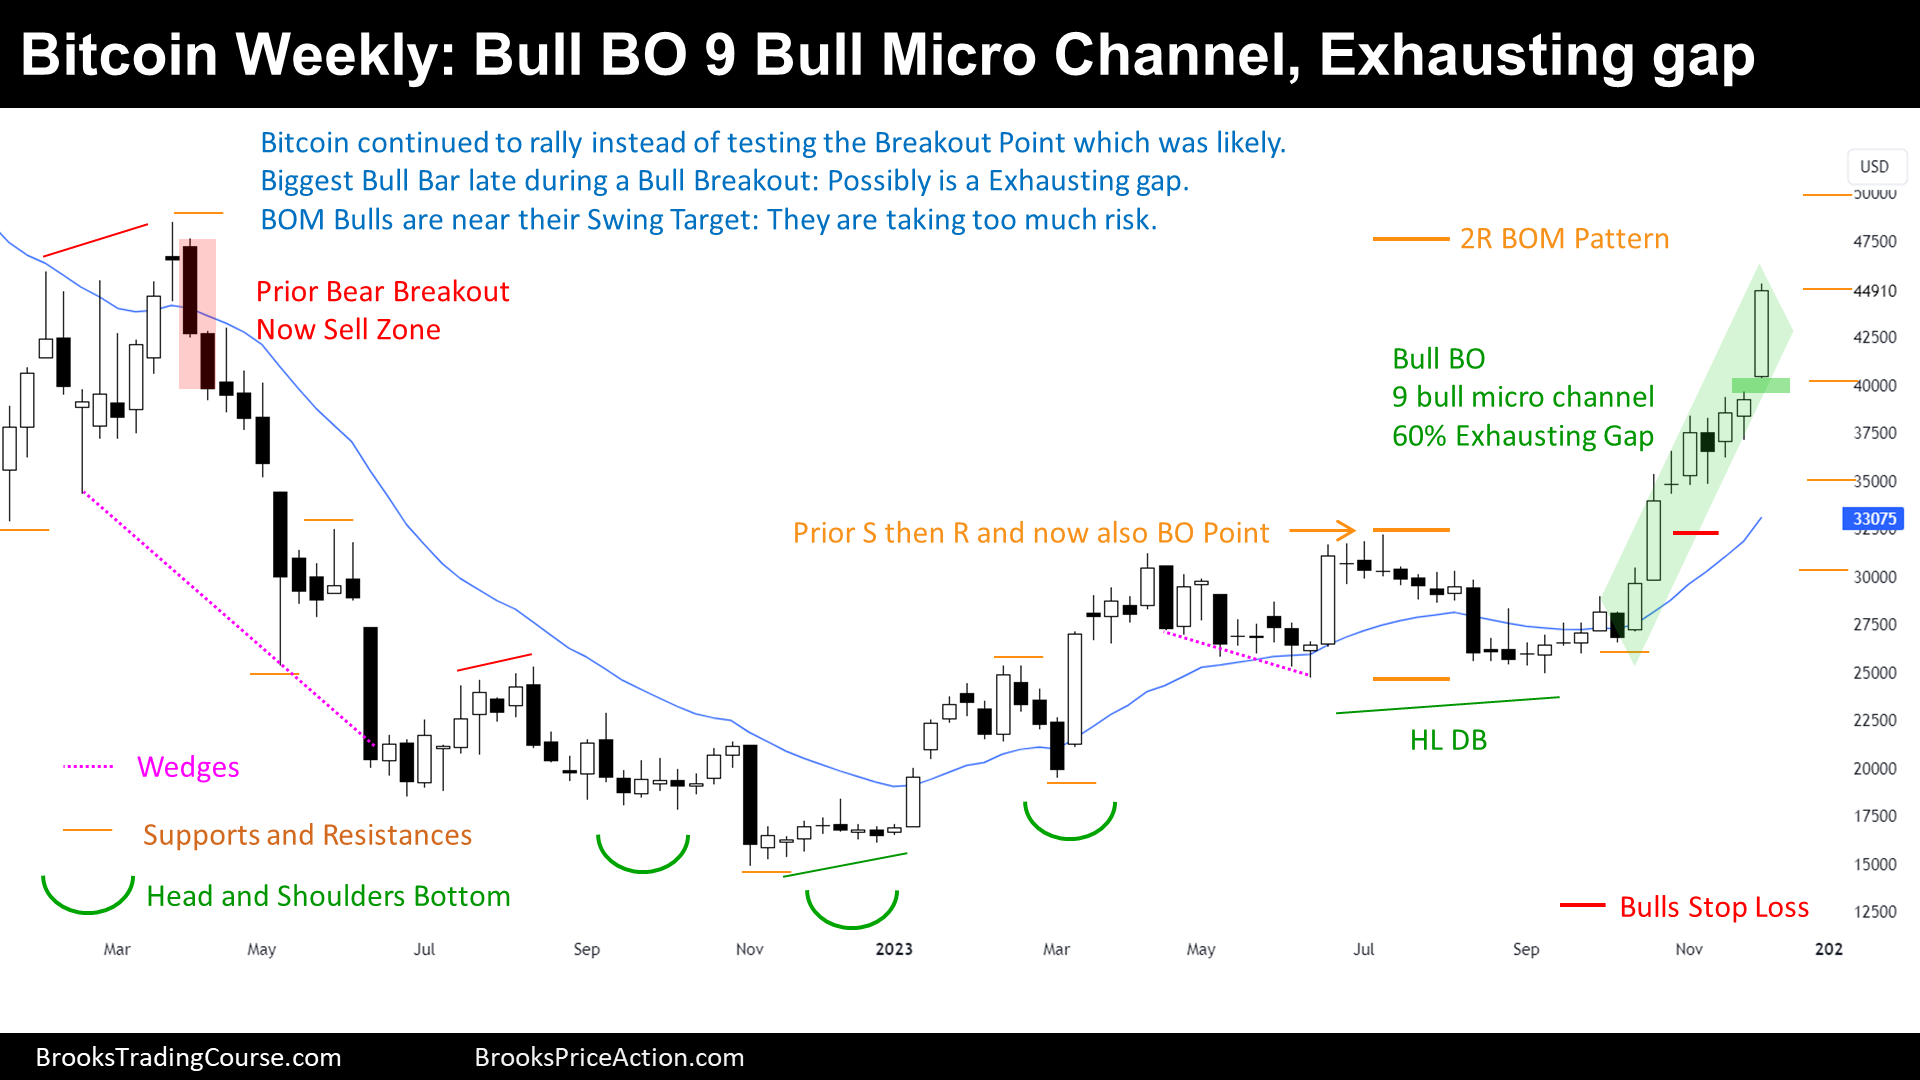
Bitcoin achieved a big bull bar late in a Bull Breakout. The price rallied 17.60% respecting the past week’s close. However, this surprising Bull Breakout occurs after many bars into a Bull Micro Channel, which is often an exhaustive move, meaning that it is more likely to trade lower towards $40000 than higher towards $50000.
Bitcoin futures
The Weekly chart of Bitcoin futures

Past: Support and Resistances
- The price started a Strong Bear Channel:
- Bear Flag’s Breakout Point (now rectangle’s Breakout Point).
- Major Lower High.
- Trading Range Apex (prior fair price).
- Then, failed a Breakout Below a Bear Flag and Reversed up, forming a HSB (Head and Shoulder Bottom) pattern, that broke up:
- 2022 Low.
- 2022s Major Higher Low.
- 2023 Major Higher Low.
- HSB Breakout Point
- HSB Measured Move around $35750 already reached.
- 50% Pull Back at around $42000, from all-time high to 2022 low.
- Then, the price has been sideways creating a Double Top and a Double Bottom, which is a Trading Range, and because the Trading Range was not wide, was also a Rectangle and Breakout Mode Pattern (BOM).
- BOM High.
- BOM Low.
- Finally, the price did a Bull Breakout of the BOM:
- BOM high is now Breakout Point.
- Breakout Low is a Major Higher Low.
Present: Market Cycle
- The gapped up this week, and then traded higher, creating the biggest bull bar of a Bull Breakout after many bars.
- We are probably in a broad Trading Range instead of a strong bull trend, this is because on the left of the chart there were strong sellers.
- Furthermore, many bulls were trapped around here, and now it is a sell zone.
Future: Inertia
- There is a 60% chance that this gap is an exhausting gap instead of a measuring gap:
- The price is more likely to test this week’s low instead of achieve a measured move up based upon the size of this week’s range.
- If we are in a Trading Range, what comes after a Bull Leg is a Bear leg.
- In a Trading Range, Traders are looking to buy low and sell high.
Trading
- This week’s candlestick is a huge Bull Breakout bar; however, it is occurring late in a Bull Micro Channel, and it is far from the 20-week EMA. Moreover, there might be trapped bulls around this area and they should add selling pressure.
- Bulls:
- For Bulls that bought during the Bull Breakout or with a Stop order above the pattern (call it Rectangle or Breakout Mode Pattern):
- We have been saying that taking partial profits is good for risk management. Taking more partials here it is also a good idea, since the price it is near the swing target. Traders are risking too much of their profit if they keep the stop loss below the bull breakout low and wait for the target to get hit.
- Flat Bulls will wait for a failed attempt to reverse the Bull Breakout (Bull Trend Thesis) or buy a bottom pattern around $30000 (Trading Range Thesis).
- For Bulls that bought during the Bull Breakout or with a Stop order above the pattern (call it Rectangle or Breakout Mode Pattern):
- Bears:
- They are looking to sell a Low 2 or a topping pattern around this area.
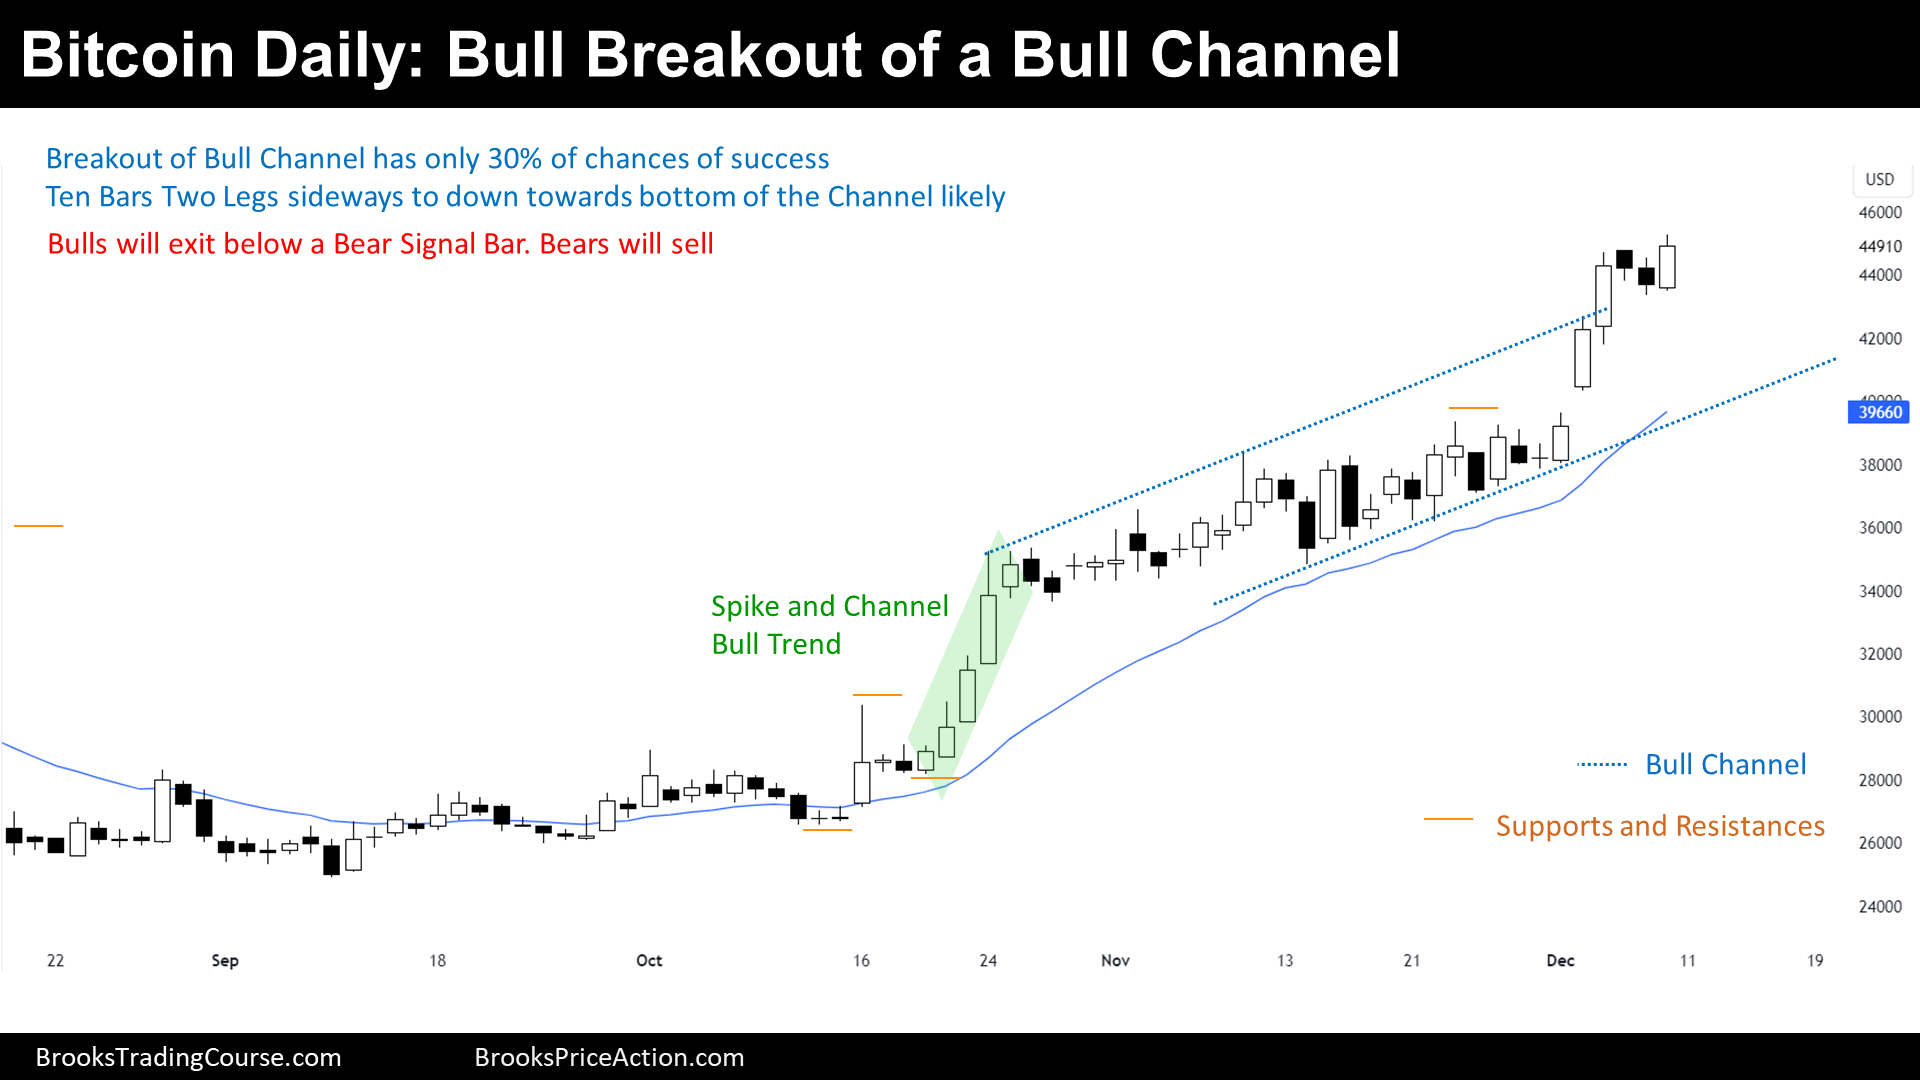
The Daily chart of Bitcoin futures

Past: Support and Resistances
- The price did a Bull Spike (Breakout) and Bull Channel.
- Breakout Points are now support.
- Bull Spike Low.
- Parabolic Wedge Top Low.
- 20-day Exponential Moving Average (EMA).
- After a Wedge Top, the price did a couple of legs sideways to down.
- Bull Channel Top.
- Bull Channel Bottom (Bull Trend line).
- Lately, the price broke above the top of the Bull Channel:
- Bull Breakout Low.
Present: Market Cycle
- The current Market Cycle is a Bull Trend, a Tight Bull Channel (and Bull Spike and Channel).
Future: Inertia
- The price did a Bull Breakout late in a Bull Trend, which normally it represents exhaustion instead of strength.
- Moreover, only 30% of attempts to break above a bull channel lead to successful bull breakouts, and hence, Traders do not expect a trend continuation, instead, expect a couple of legs sideways to down.
- If there will be a bear reversal, the price will likely transition into a Trading Range first, that means, going sideways for at least 20 days.
Trading
Since there is a 70% chance that the price is going to have, at least, a small reversal, Bulls (for taking profits) and Bears are looking to sell below a Bear Signal Bar.
- Bulls:
- Bulls who are in the Trade will probably exit or take partial profits below a Low 2 setup or a Bear Signal Bar, and buy again if they fail to trade lower.
- Bears:
- Bears will try to sell a Low 2 setup or a good Bear Signal Bar, targeting the Bull Breakout low.
Market analysis reports archive
You can access all the weekend reports on the Market Analysis page.

