Market Overview: Bitcoin Futures
Bitcoin bearish follow through closed the week at the lows of the week, below last week’s low: traders continued selling. When June closed (the semester) the price went up; hence, traders won’t be surprised if the price reverses up again around there; However, there are decent signs of bearish strength suggesting a 30% decline from current prices.
Bitcoin futures
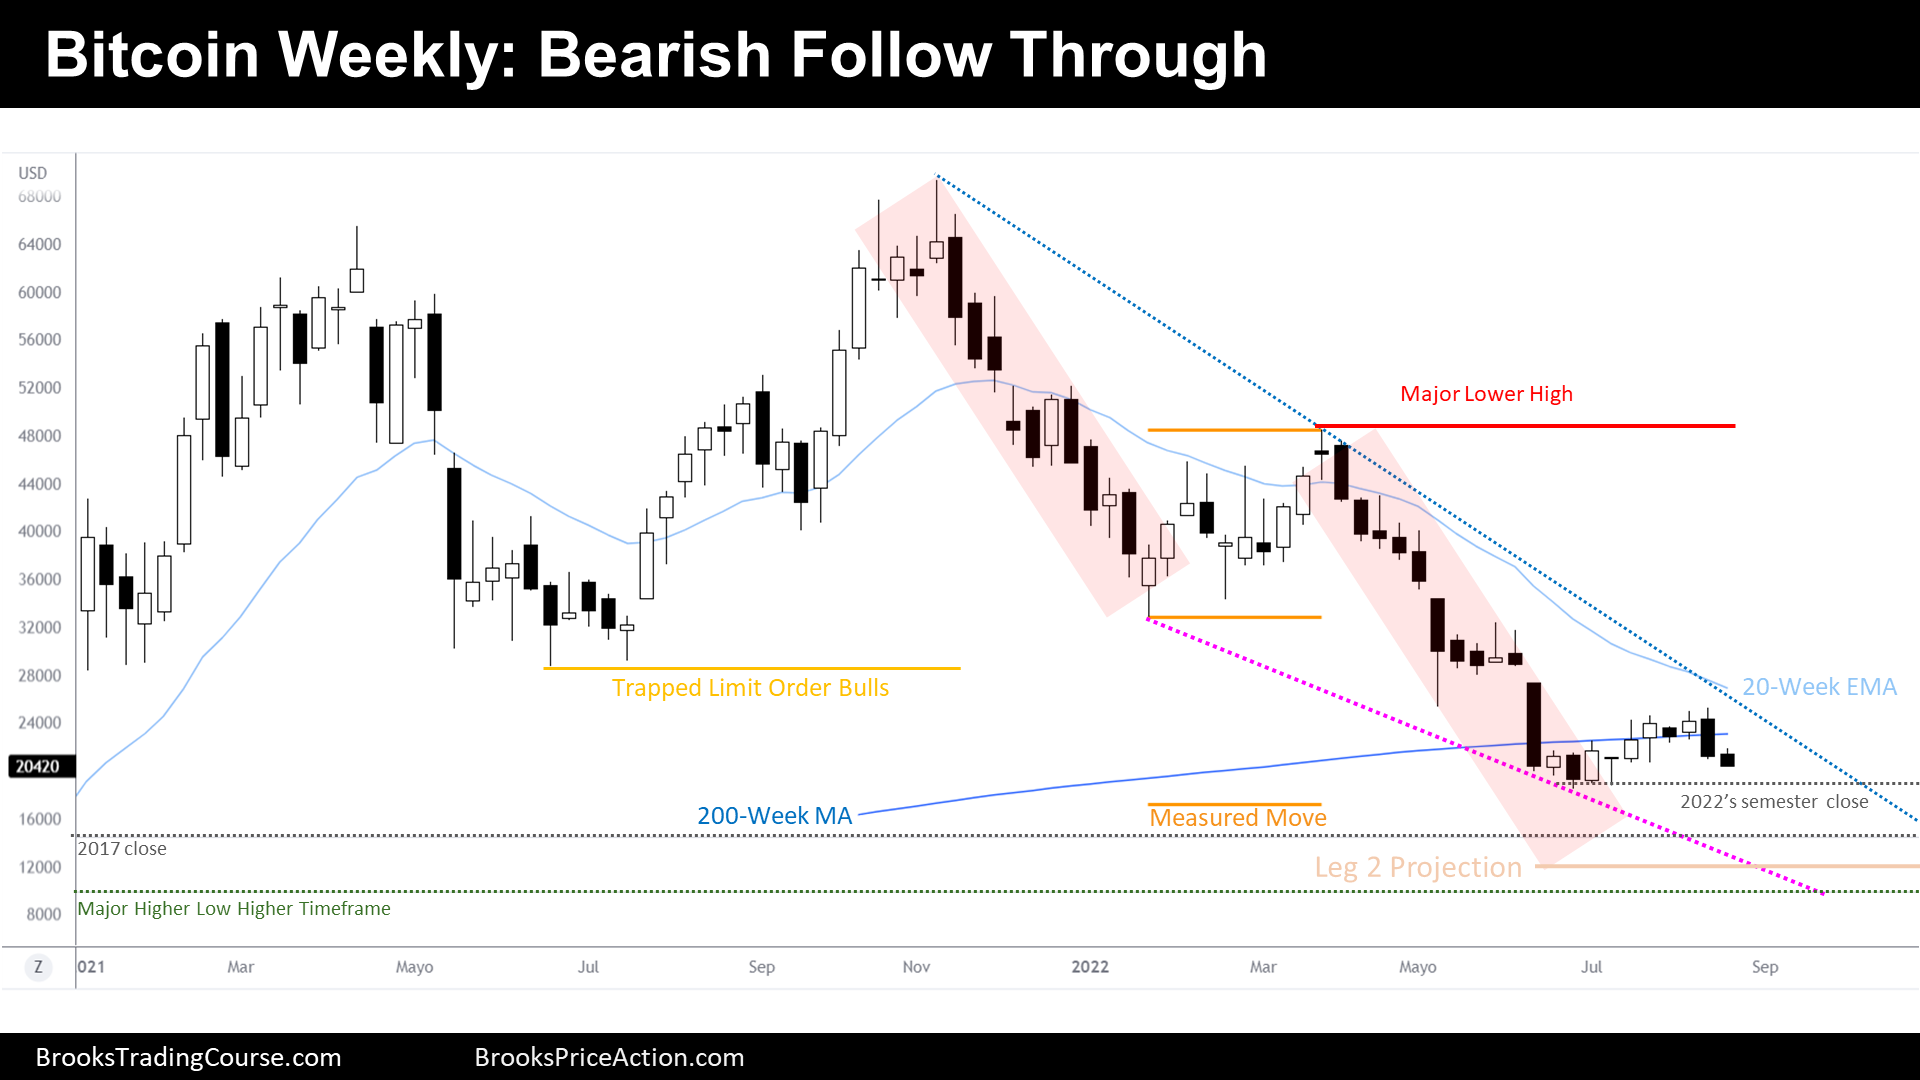
The Weekly chart of Bitcoin futures

- This week’s Bitcoin candlestick triggered a Low 2 sell signal bar. The weekly bar closed at the low, which means that bears got good follow through.
- We have been insisting that this year there should be a test of the year lows because the prior bear leg was strong enough to generate, at least, another leg sideways to down.
- Furthermore, we have said that the price might be within a two legs sideways to up move, which typically happens after a wedge bottom pattern at support.
- The most important price this year, will probably be the June close.
- After June close, traders bought; Therefore, traders expect that same behavior when the price trades around there.
- But, bears have now two consecutive good bear bars happening at the top half of the bear channel.
- They feel strong because they see that the price could not close the most influential opened gaps; even better, latest attempts to close those gaps are failing.
- Is it worth selling around current prices? Probably not because this would be the third leg down. Traders feel they are late when entering during third legs; if they decide to sell, they will use a tiny position.
- The strongest sellers on this chart are the trapped limit order bulls. If they sell below year lows, the price will rapidly reach next supports. But, are they going to sell? Surely, some will sell: bears keep gaps open while the price is making lower lows.
- Yet, the fact is that some trapped traders will not sell, they will maintain their positions until the price gets back, at least, to their first entry price (at around $29000).
- Even if we do not expect many sellers, we can’t ignore that the inertia is bearish; thus, we should look to next supports: there are various measured move projections like leg 1—leg 2, or a bear flag range.
- But, the most important support below the June 2022 low is the 2017 close.
- Within the past semester report, we have said that the price is contained within a broad bull channel and that this major drawdown is, currently, just a bull flag. If the price trades at or below $9900 (major higher low on the monthly chart), the bull flag and the bull channel are over.
- The price, with the current information, it is at a buy zone. After so much volatility during 2021 and 2022, bulls want sideways trading between the June 2022 close and the 2021 close.
- Bears goal is a consolidation below the June 2022 close. It is possible; but for now, Bitcoin is above that price.
- This next week it is the close of the monthly candlestick. July was a good bull bar.
- August triggered the bull bar and so far, it looks like there were sellers above, a pretty bearish sign.
- The middle price of July is around $21600, bears want to close below that price and bulls above. Traders will check participant’s strength.
- Because this week’s candlestick is a good bear follow-through bar within a bear channel, we should expect lower prices next week.
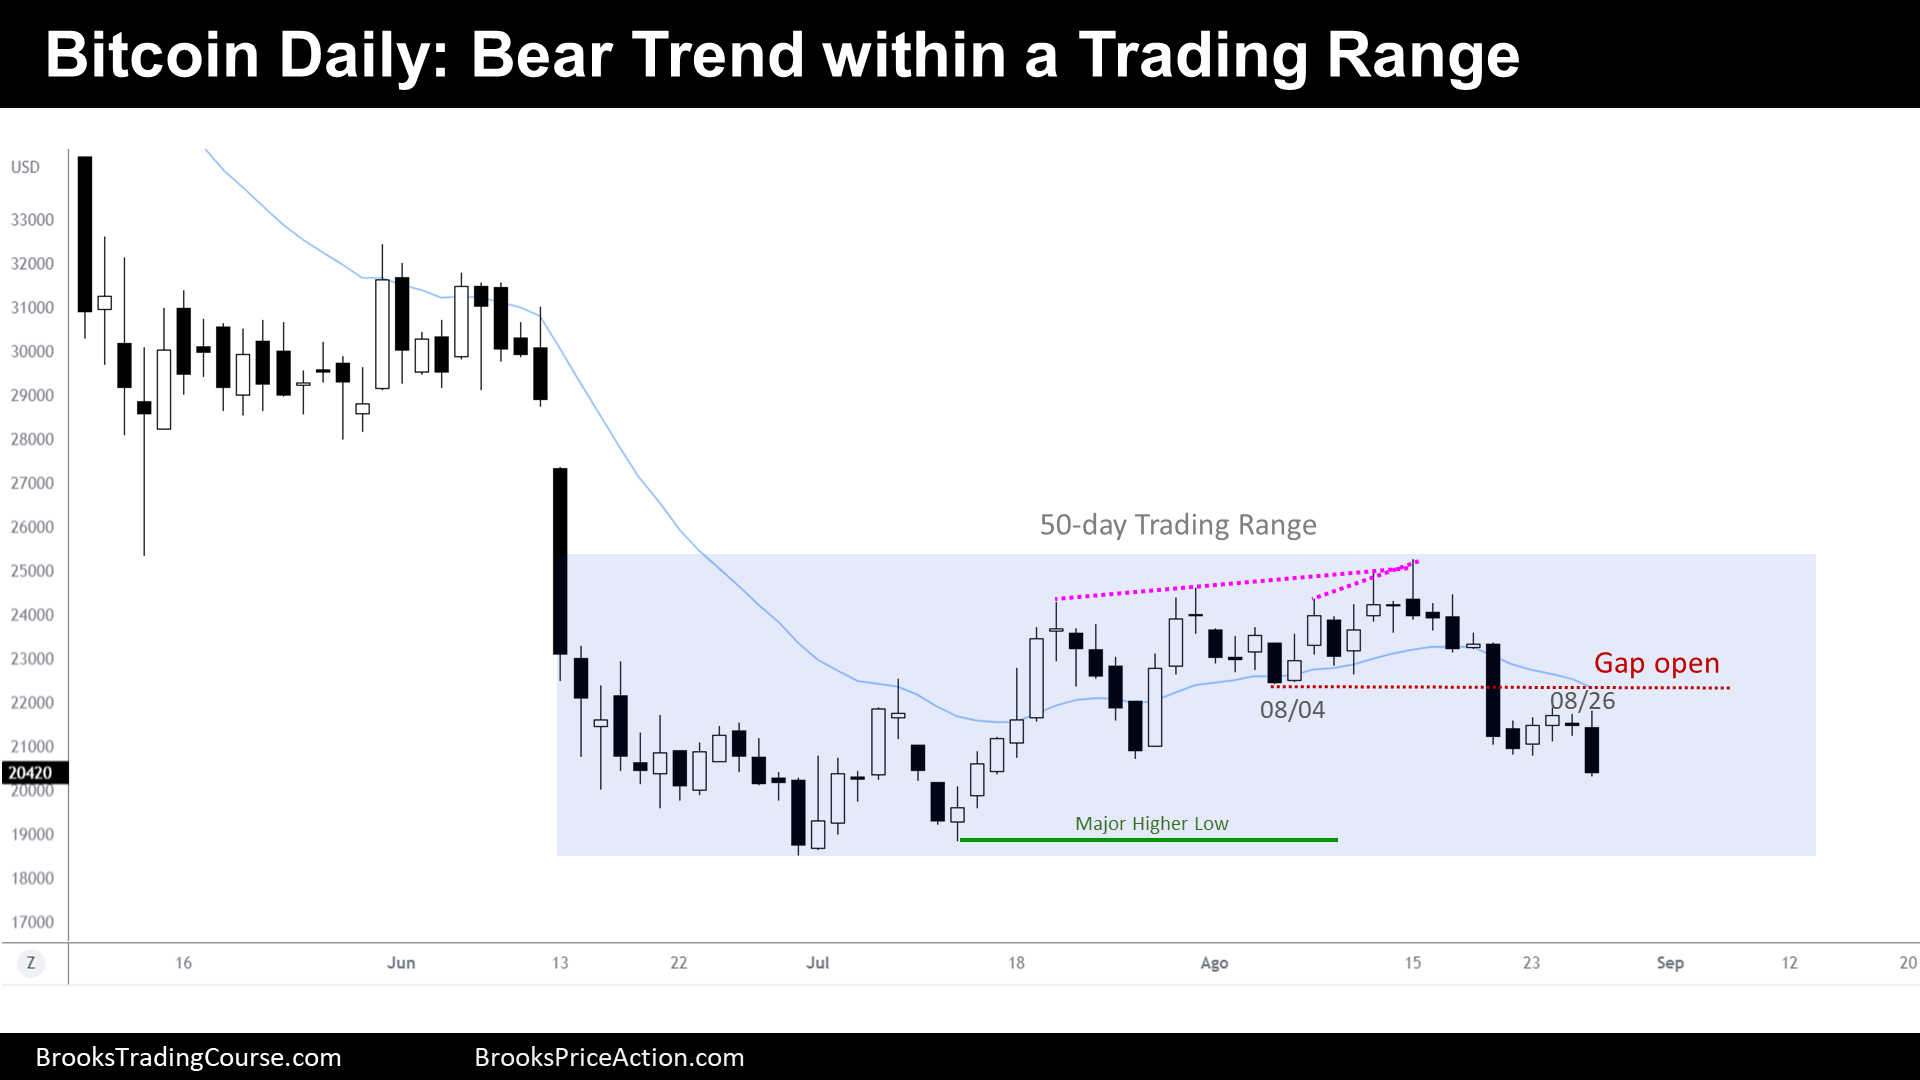
The Daily chart of Bitcoin futures

- The price is within a 50-day trading range.
- Last week, we have said that we should expect some kind of bearish pause during this week and then, another leg down. And this is what happened.
- We were expecting a second leg down because after a wedge top, we anticipate two legs sideways to down.
- We said that there should be a pause because some bears were reaching their profit targets.
- Now, traders wonder if the bears have any chance of breaking the trading range to the downside. The answer is yes.
- Bears are strong, last week the price broke below 08/04 low and this week it failed to close the gap and then the price reached a new low.
- Within last report, we mentioned that traders are making money with stop order entries, buying low and selling high in the trading range. We have said that before the bulls start buying, we should expect a reversal pattern to develop first; we should not expect, suddenly, a bull reversal.
- Therefore, bulls will wait until a reversal pattern to unfold before buying.
- The aspect of the bear legs are plausible, that legs have the potential to become a bear trend, if gaps remain open.
- Both, bulls and bears, know that while the price remains above the major higher low, we can call this bearish move a bull flag.
- However, the odds are that the bears will succeed in their attempt to invalidate the bull flag thesis. We insist, bears have good potential.
- If the price reverses up next week, it will become, more likely than not, just a bear rally. There might be bulls trapped around the top of the trading range because, until the bear breakout occurred, the price was within a bull channel. Hence, we should expect trapped bulls around there, willing to sell and scale out their positions when they get the chance.
- But traders should expect the price to continue down and test the major higher low next week.
- It is hard to sell in the bottom half of a trading range.
- If we see relentless selling, it could mean that the market cycle is no longer a trading range, but a bear trend.
Market analysis reports archive
You can access all weekend reports on the Market Analysis page.


Great analysis Josep
Thank you very much for taking your time to read and comment the report. Have a lovely week ahead, Gerard!