Market Overview: Bitcoin
Bitcoin painted a picture of a market in transition. While a High 3 buy setup emerged, it was followed by bearish signals and hints of a potential buy climax. This suggests the possibility of evolving into a trading range, especially after a strong bull trend. While uncertainty remains, both bulls and bears are keenly observing price action for clues about the market’s next major move.
This week takes on added significance as we approach the monthly close. The current monthly bar presents a strong bearish signal, closing near its low. If a new low doesn’t materialize, April could become the 7th bar within a bullish micro-channel. This potential setup bears watching, as history shows that strong bull breakouts often experience buying pressure on bearish retracements, at least enough for another test of the breakout high.
How will this tension between the weekly and monthly timeframes resolved? Will the bulls find renewed strength to push prices higher, or will the bears solidify their short-term dominance? The coming days and weeks will provide the answers.
Bitcoin
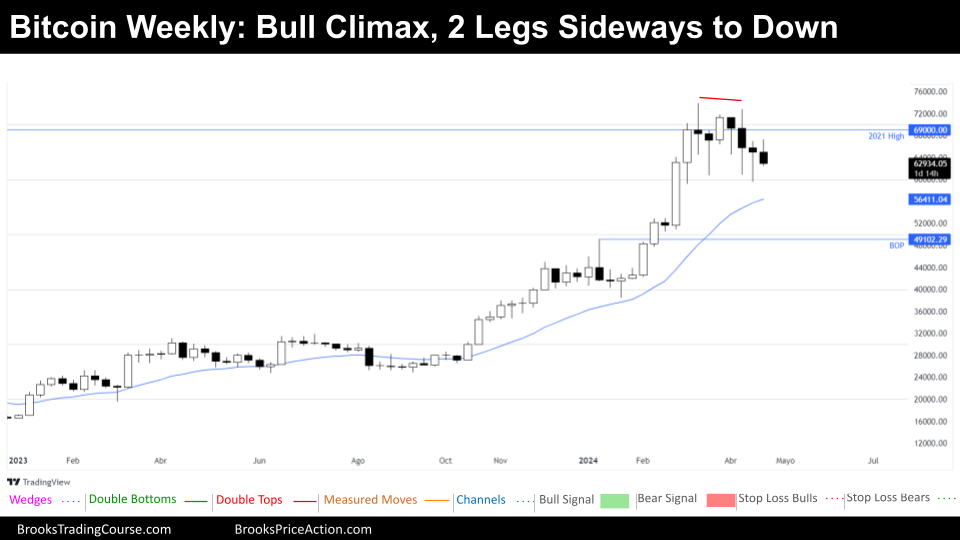
The Weekly chart of Bitcoin

The Bitcoin market experienced a reversal down this week, after trading above the previous week’s high, a High 3 buy setup. However, this setup was a bearish doji candlestick, indicating indecision. While the market is technically Always In Long, we’re observing a transition from the recent tight bull channel to, at least, a weaker phase of the bull channel.
The current market behavior hints at a potential buy climax. The market’s forceful buy vacuum test of resistance (2021 all-time high) supports the buy climax hypothesis. If this scenario holds true, we anticipate a shift into a trading range instead of a continuation of the Bull Channel.
Nevertheless, it’s important to note that this could also represent a temporary pause within a continuing bull channel. If prices establish a new higher high followed by another pause, the current activity could simply be interpreted as a minor pullback within a larger uptrend.
What’s interesting is that even in a potentially climatic environment, bulls were able to profit from “scalping” trades – buying the initial pullback after a 7-period bull micro-channel.
Bulls may attempt additional scalping opportunities if prices test the 20-week EMA. The lack of substantial bearish momentum reinforces this possibility. Bears who sold during the buy climax may close at least a portion of their positions when price encounters that first clear support level – the 20-week EMA. Additional support levels exist at $50,000 and a previous breakout point, lessening the downside risk.
It will be interesting to observe whether the market reaches the EMA before a definitive Always In Short signal emerges. An Always in Short market will change Bulls’ confidence.
From the bears’ perspective, this week’s price action could form a favorable bearish setup if it closes near its current low. However, the bears face challenges due to the strong support levels and the market’s general anticipation of a trading range rather than a steep decline.
Bulls, on the other hand, will seek a strong bullish close. Ideally, this bullish surge would originate from the EMA or the $55,000 round number support. If this week concludes with a bearish bar closing near its low, the probability of further price declines next week increases.
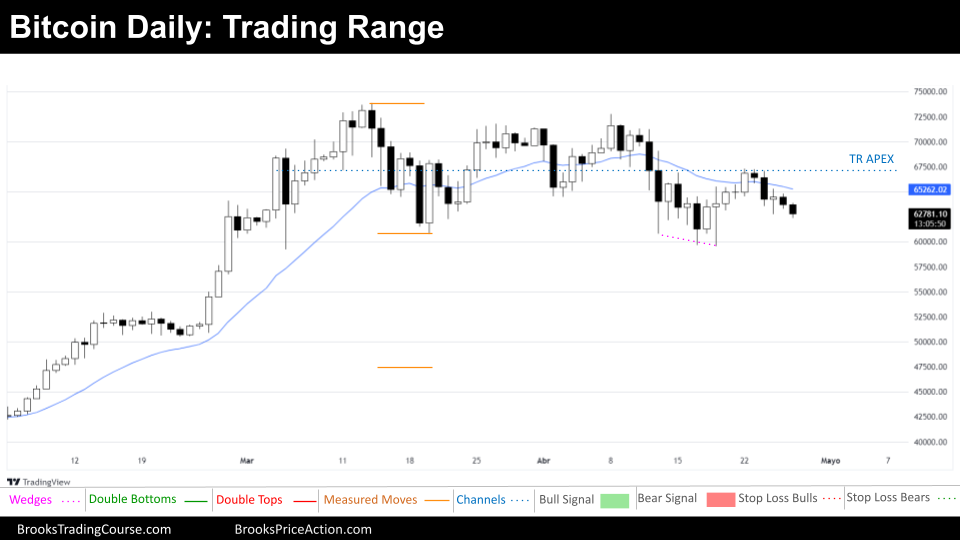
The Daily chart of Bitcoin

Bitcoin’s daily chart currently presents a state of uncertainty. Bears interpret the recent price action as a failed bull breakout from a triangle formation, signaling potential weakness. Bulls, on the other hand, anticipate a higher low following the lower low, hoping for a continuation of the prior uptrend. For the time being, however, the market appears confined within a trading range.
Markets inherently seek equilibrium, leading to periods of consolidation where both bulls and bears perceive value. This creates a trading range marked by uncertainty, with frequent rallies and selloffs that ultimately stay contained. Occasionally, a decisive breakout occurs, signaling newfound consensus on price direction and leading to a new trading range.
Importantly, every trading range contains the potential for the next major trend to emerge. For now, the most prudent strategy within this range is to “Buy Low, Sell High, and Scalp” (BLSHS). This involves maximizing profits from shorts and longs taken at the range boundaries. It is important to avoid trades within the middle third of the range, where price action is less predictable.
It’s also crucial to recognize that most breakout attempts from trading ranges ultimately fail. Strong rallies or selloffs can be deceptive, leading less experienced traders to make impulsive decisions based on the hope of a sustained trend. These often prove to be buy vacuums or sell vacuums testing the range’s extremes without significant follow-through.
The Bitcoin market is frequently pulled towards both the top and bottom of its trading range. Seasoned traders understand this dynamic and resist the temptation to chase big bullish or bearish moves near the range’s limits. Market inertia dictates that a high percentage of breakouts in this environment will prove unsuccessful.
Let’s spark a discussion! What are your thoughts on the current Bitcoin trading range? Do you agree with the analysis? Please have no hesitation to comment, offer your insights, and share this report with other traders.
Market analysis reports archive
You can access all the weekend reports on the Market Analysis page.


I agree with the analysis. I would think, however, if there is no strong rally within the next 7-9 days that the market will fall to the next lower level of support as indicated here.
Marge, thanks so much for sharing your thoughts! We always appreciate your constructive perspectives. You’re absolutely right about the importance of watching those support levels in case there is no bull trend resumption. It’ll be interesting to see how the next week plays out!
Thanks Josep for your detailed report.
I see what you see but more consider the current h…N structure as h2 and less for h3. Therefore would like to see additional drop down that is below the low of what I consider as h2 (last week low) or at least below the agreed h1 low and much closer to the 20ema (truncated wedge). The monthly chart is also crucial to determine where we are heading PA wise, March was a BO and ATH new close. The BO is still intact and as long as this month close will not be below the close of 10/21(61.5k), body gaps remain which is good for the bulls. If April close will be below the close of 10/21 thus, we get similar structure of 11/21bear close vs 03/21 bull close which may lead to further move down.
Eli, this is such a detailed and insightful analysis – thank you for sharing! I like how you’re approaching the H2/H3 structure, and you raise excellent points about the significance of the monthly chart. Your understanding of market dynamics is impressive. Let’s keep a close eye on which pattern develops!
I agree with the bear thesis. I was looking at a possible 50% PB from Sept 11 low to Mar 11 high. Price potentially getting to the 49500 area before more upside. Which would coincide similarly to your MM target.
Thanks for adding your perspective to the mix! It’s always helpful to consider different potential scenarios, and your bear case of the potential pullback target adds a valuable dimension to the discussion. Let’s see what the market has in store for us!