Monthly S&P500 Emini futures candlestick chart:
Strong breakout to a new all-time high
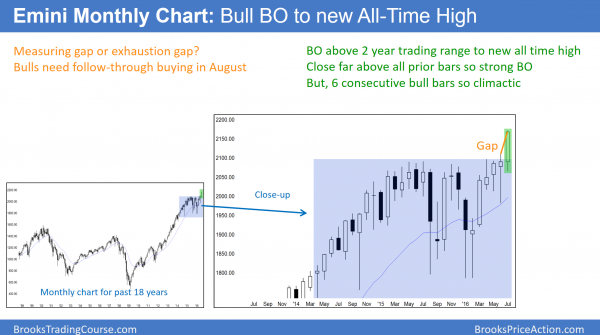
The monthly S&P500 Emini futures candlestick chart had a big bull trend bar closing on its high. The gap is the space between the close of this month and the high of last month. This is a strong bull breakout. However, it is the 6th consecutive bull bar and therefore a buy climax.
The monthly S&P500 Emini futures candlestick chart is breaking above a 2 year trading range. July was a big bull trend bar closing on its high. It therefore is a strong bull breakout bar.
August is important. The bulls need follow-through buying, which consequently would validate the bull breakout. Hence, it would increase the chances of higher prices over the coming months. The bears want a bear bar and therefore a potential failed breakout. The bulls have 6 consecutive bull trend bars on the monthly chart. While this is a sign of strong bulls, it is rare and therefore unsustainable. Hence, it is a type of buy climax.
The odds are that August will have a bear body. Because the bulls are strong, the first reversal down will probably be bought. Therefore, the downside risk on the monthly chart is small. The best the bears probably will get is a 1 – 3 bar (month) pullback.
Weekly S&P500 Emini futures candlestick chart:
Weakening bull breakout
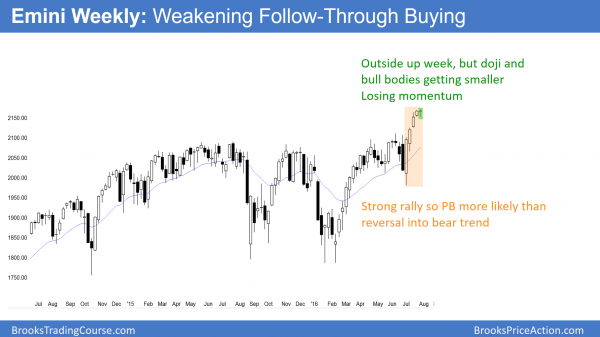
The weekly S&P500 Emini futures candlestick chart formed an outside up bar this week. Yet, it was only a doji bar. Furthermore, it is the 5th consecutive week where the bull bodies have been shrinking.
The weekly S&P500 Emini futures candlestick chart formed an outside up bar this week. However, it was only doji candlestick pattern and not a big bull trend bar closing on its high. While this comes after 4 consecutive bull trend bars, the bars have been getting less bullish. The bodies are shrinking. As a result, traders see the momentum decreasing. Consequently, there is a 60% chance of a pullback within the next 3 weeks.
Because this week was a small sideways bar in a bull trend, it is a buy signal bar. Yet, it was a doji and the momentum is dissipating. As a result, if next week goes above this week’s high and triggers the buy signal, bulls will be quick to take profits. Limit order bears will probably begin to sell above bars, betting that the buy setup is weak. They expect a pullback within the next few weeks and will begin to sell strength for scalps.
As a result of a weak buy setup, the odds are against a strong move up without a pullback. However, the Emini will probably trigger the buy and go at least a little higher.
The potential Black Swan is a big bull breakout, which would create a potential measuring gap. If the bulls are surprisingly strong, traders cannot be paralyzed by the unexpected happening. Never question what any market is doing. If it goes up, look to buy. If it goes down, look to sell.
Daily S&P500 Emini futures candlestick chart:
Unfounded fear of an August stock market crash
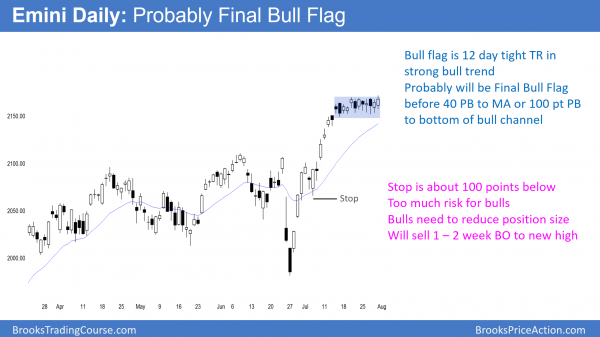
The daily S&P500 Emini futures candlestick chart broke above its 12 day tight trading range on Friday. The breakout so far is small.
The daily S&P500 Emini futures candlestick chart has been in a tight trading range for 12 days. While today broke above the range to a new all-time high, the Emini soon reversed down. Hence, the bull breakout was not strong. Because the tight trading range is in a bull trend, the odds favored a bull breakout. That breakout began on Friday. As a result, the Emini might trade up for another week or two. Yet, the rally will probably fail.
The stop for the bulls is still about 100 points below. Many institutions cannot tolerate that much risk. Hence, they will look to reduce their position size. This means that bullish institutions will start selling to take profits. Due to the bulls selling in addition to the bears who are always selling, the Emini will pullback soon.
If there is a rally, how far up will it go? A minimum target is a 12 point measured move up, based on the height of the 2 week tight trading range. If it breaks above that, the next target is the 2,200 round number. If the bears get a strong bear breakout, that could be the start of the pullback. Because most trading range breakouts fail, the odds are that the bulls will buy bear breakout. As a result, the bulls will then probably get their final rally before the pullback begins.
40 – 100 point pullback in August
The July reversal pulled back on July 6. The 2065.75 low was the start of the 2nd leg up after the bull breakout (bull spike). While the leg was strong, it was also a type of a parabolic channel in a Spike and Channel bull trend. Hence, it is a magnet.
Will the Emini reverse all of the way there in August? Although the top of the 2 year trading range at around 2,100 is support, this July rally was extreme. An extreme move is unsustainable and therefore climactic. As a result, the pullback might be more than 2%. A 2% pullback is 40 points. A test of that low is about 100 points and 5%.
Compare today to 2014
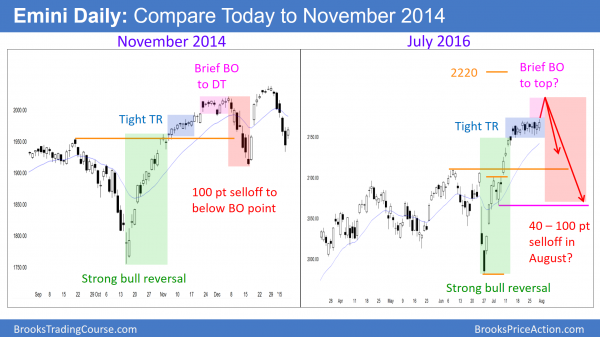
The chart on the left shows the strong bull reversal in October 2014. The Emini then briefly entered a tight trading range. After a small breakout, it formed a double top in November. The 100 point selloff in December lasted only 7 days. The chart on the right shows the current July strong reversal up and then a 12 day tight trading range.
While the Emini probably will not follow 2014 exactly, 2014 illustrates the concept. When the stop is far below, the Emini has an increased probability of a deep, fast selloff. The selloff will probably be 2 – 5%, which is 40 – 100 points.
The Emini formed a similar chart pattern in 2014. It rallied strongly in October and then entered a tight trading range for 5 days until November 17. The bull trend resumed for a few weeks, formed a double top, and reversed down 100 points. The selloff fell far below the breakout point, which traders thought should have been support.
Chart comparisons like this can mislead traders. I am not saying that the Emini will do the same thing in August. I am using that 2014 rally as an example of what might happen when the stop is far below. It shows that this kind of buy climax can quickly reverse 100 points down. The odds are against that, but there is a 40% chance of it happening. There is a 60% chance of at least a 40 point pullback over the next few weeks.
Fear of an August stock market crash?
While crashes on the 5 minute chart come a couple of times a week, and almost daily on the 1 minute chart, crashes on the daily chart are rare. I have been trading for 30 years and have seen some surprisingly big selloffs in August and October. The odds are high that August will correct down. The selloff might be fast, scary, and far. Yet, traders will correctly see it as a pullback in a bull trend and they will buy it.
Traders can see the end of the day bar-by-bar price action report by signing up for free at BrooksPriceAction.com. I talk about the detailed Emini price action real-time throughout the day in the BrooksPriceAction.com trading room. We offer a 2 day free trial.
When I mention time, it is USA Pacific Standard Time (the Emini day session opens at 6:30 am PST, and closes at 1:15 pm PST). You can read background information on the intraday market reports on the Intraday Market Update page.


Al,
First of all let me thank you for all the knowledge you have given us, it’s priceless. My question relates to the comparative chart in this weekend edition, today vs November 2014 – the scaling on the left of the chart for November 2014 regarding the lo’s for October 2014 almost touch 1750, when in reality 1813 was the low, and the hi for September was 2014 with a top of 2079 for December 2014, now maybe left scale on the chart is an approximation, if this is so then the hi’s and lo’s make sense. The July 2016 chart makes sense – context and price and scale. I question am I missing something?
Thank you Ron Carlson
Al,
I get it it is for illustration purposes – that explains it.
Ron Carlson
Dear Mr. Brooks
First of all I’d like to express my admiration and appreciation for your achievements and work.
To manage, or not to manage?
At the end of every trading day I review my trades and trading actions (trade management) of that day.
Quite a bit more often than not, I come to the conclusion that I would have done better if I would have left my trades untouched, run it’s course and trusted my initial decisions to enter these trades.
Based on the thought that when a trader would trade randomly (with a risk/reward ratio 1:1), over time with many trades the trader will end up breakeven minus cost, it would be interesting to note that these random trades would range from (very) low probability to (very) high probability with 50/50 in the middle.
With education, experience and strategy the trader develops better judgment for entering trades with a higher than average probability and will end up with more winning trades than losing trades.
I trade Forex pairs on 5 or 15 min timeframe charts with a 1:1 risk/reward ratio, usually somewhere between 20 and 40 pips, 1 – 2% of equity depending on the situation.
Would it to your opinion be reasonable to trade with a proper strategy without interfering the open trades and do you have any further thoughts about this?
Best regards,
Alexander
On average, buying or selling at any time for a reward equal to risk is a 50% bet. The key to making money is to either increase the probability while not decreasing the reward/risk too much, or increasing the reward/risk while not decreasing the probability too much. That is the essence of price action trading. There are some setups that have high enough probability to offset the reward/risk, and others that have high enough reward/risk to offset a lower probability. The key is learning how to see and then structure these trades.
Thank you for your response, your answer is clear and I understand.
I am a new member and I’m looking forwards to the release of the new course.