Monthly S&P500 Emini futures candlestick chart:
Buy climax at Final Bull Flag measured move target
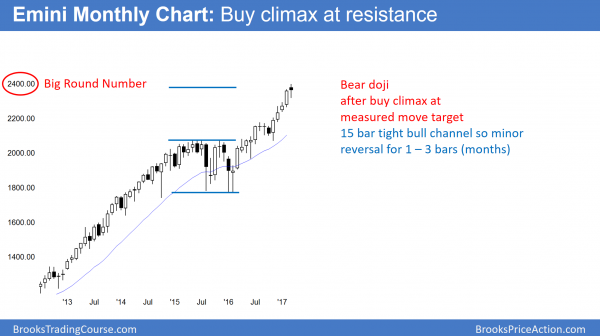
The monthly S&P500 Emini futures candlestick chart had a bear body this month after last month’s big bull bar. Yet, the bar was a doji bar, and therefore a weak sell signal bar after a 4 bar rally.
The monthly S&P500 Emini futures candlestick chart has rallied strongly for 15 months. In addition, it was especially strong for the past 4 months. This month was the 1st bear bar in 5 months. Because it closed near the middle and not near the low, it is a low probability sell signal bar. Hence, there are probably buyers below its low. Therefore, a reversal down would probably be minor, even if it lasted a few bars (months). As a result, the best the bears will probably get is a pullback into a bull flag.
Final Bull Flag
The Emini was in a trading range for more than 20 bars in 2014 and 2015. Since that was late in a bull trend, it was probably the Final Bull Flag. Bulls therefore take profits around a measured move up. The March high was at a measured move up. Therefore the location is good for a major top on the monthly chart.
Yet, a major top needs some selling pressure. A 15 bar tight bull channel usually has to transition into a trading range before it can reverse into a bear trend. Therefore, the bears will need at least a micro double top before they can create a major reversal. Hence, the downside risk is small over the next 2 or 3 months.
When there is a Final Bull Flag reversal, the target for the bears is the bottom of the Final Flag. That is around 1800. How long would it take to get there? It might take 10 – 20 bars, which is 1 – 2 years. There is no sign of a reversal yet. However, if the bears begin to create a strong reversal, 1800 would be their target.
Bears need micro double top
A micro double top on the monthly chart is a small double top on the weekly chart and a big double top on the daily chart. Hence, a micro double top can sometimes lead to a major reversal. Therefore, traders will watch what the market does after it pulls back and then tests the March high. If there is a strong sell signal bar in May or June, the bears will have a better chance of a major reversal.
Weekly S&P500 Emini futures candlestick chart:
Strong reversal up after last week’s bear breakout
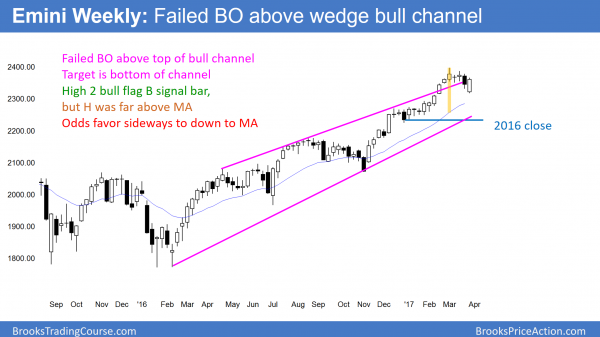
The weekly S&P500 Emini futures candlestick chart had a big bull trend bar this week after the prior week’s strong bear reversal down from measured move targets.
The weekly S&P500 Emini futures candlestick chart reversed down strongly after a micro double top at the measured move up from a 2 year trading range. Yet, the bulls reversed the Emini up even stronger this week. This week is therefore a buy signal bar for a High 2 bull flag. Since the weekly chart is still Always In Long, bulls can buy above this week’s high.
But, this week’s bar was big. Therefore, the stop for the bulls is far below. Hence, the risk is big. In addition, the bulls are buying close to the top of a 5 week tight trading range. Furthermore, this is at the resistance of a measured move target.
As a result, this is a low probability buy setup. When the probability is low and the risk is big, there are usually more sellers than buyers above the buy signal bar. Therefore, sideways is more likely than up.
Weekly buy climax
The 5 month rally has been exceptionally strong. Yet, the March high was unusually far above the weekly moving average. That means that the rally is unsustainable and climactic. As a result, many bulls will wait to buy a pullback.
If you look back at the weekly chart to find times when it was far above the moving average, more than 70% pulled back to the moving average before going much higher. Therefore, even though this week is strongly bullish, the context is bad. The odds are that the Emini will work sideways to down to the moving average before it rallies much higher.
Daily S&P500 Emini futures candlestick chart:
Bear rally?
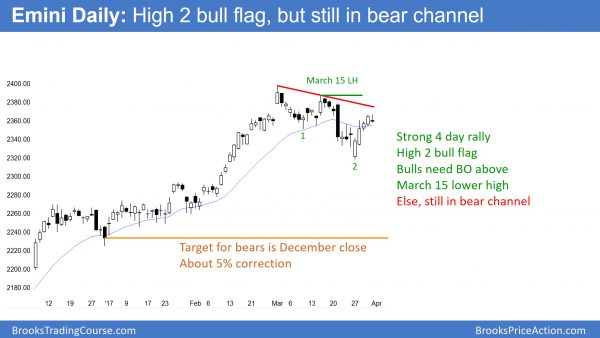
The daily S&P500 Emini futures candlestick chart had 4 consecutive bull bars this week after reversing up from a failed bear breakout. Since it still has a lower high, it is also in a bear channel.
The daily S&P500 Emini futures candlestick chart is in a bull flag and an early bear trend. Traders therefore need more bars to determine the direction of the next couple of months. The momentum up favors the bulls. Yet, the Emini reversed down from a measured move target on the monthly chart. Furthermore, there is a buy climax on the weekly chart. In addition, the reversal down has not yet reached the weekly moving average. Therefore, there is resistance above and a magnet below.
While the bulls got a strong reversal up this week, they need a strong breakout above the March all-time high. Without that, the odds favor sideways to down over the next few months.
Broad bear channel
The bears had a strong bear breakout 2 weeks ago. Since the rally is still below the high of 2 weeks ago, and the Emini also has a lower low, the Emini is in a bear channel. Yet, the bears were unable to create follow-through selling.
Most noteworthy is that the bulls reversed the market up strongly. When a market is in a bear trend, it often has rallies that are strong enough to reverse the market to Always In Long. However, if a rally fails to get above the most recent major lower high, it is still just a rally in a bear channel.
Trading range so both bull and bear setups
Since the Emini has been in a trading range for 2 months, it is neutral. There are always good reasons to buy and to sell when the market is in a trading range. As a result, the bulls and bears are balanced, and the market can continue sideways for a long time.
The buy climax on the weekly chart was unusually extreme. In addition, it was at a measured move target on the monthly chart. Furthermore, the Emini never tested the close of last year. Consequently, the probability slightly favors the bears.
April government shutdown crisis and 5 per cent correction
The next major catalyst for a breakout up or down is the congressional fight over the continuing resolution that expires on April 28. While news is only a catalyst, it can be the start of a big move. Since the odds favor a 5% correction, a fear of a government shutdown is a reasonable catalyst. Because March and April tend to be bullish, the stock market might stay in its trading range until the end of April.
Black Swan rally?
Whenever there are good reasons for a selloff, traders need to be aware of Black Swan events. This is a low probability outcome. Here, that would be a strong breakout to a new all-time high.
When a low probability event happens, traders are trapped. If there is a strong bull breakout, bulls will be trapped out because they see the market as too high to continue. Bears get trapped in because they are selling the breakout. If the rally continues, trapped bulls and bears are forced to buy. Bears continue in denial and keep selling, expecting a top. Bulls are in denial as well and keep scalping out. Both bulls and bears repeatedly have to buy. As a result, the rally can go much further up than what seems reasonable.
Will this happen? I said that this would be a Black Swan. Therefore, by definition, it is very unlikely. Yet, if it begins to happen, traders should not deny it. They should buy and hold for a swing up.
Traders can see the end of the day bar-by-bar price action report by signing up for free at BrooksPriceAction.com. I talk about the detailed Emini price action real-time throughout the day in the BrooksPriceAction.com trading room. We offer a 2 day free trial.
When I mention time, it is USA Pacific Standard Time (the Emini day session opens at 6:30 am PST, and closes at 1:15 pm PST). You can read background information on the intraday market reports on the Intraday Market Update page.


Thank you for your weekend update.