Monthly S&P500 Emini futures candlestick chart:
Buy climax at measured move targets
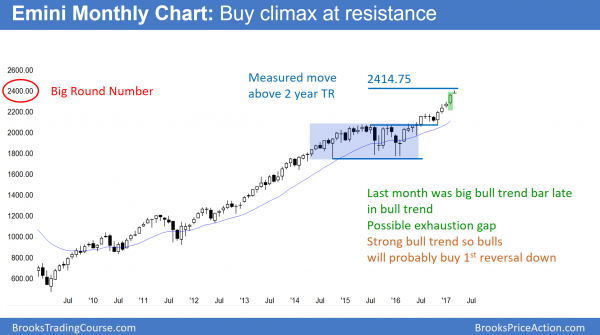
The monthly S&P500 Emini futures candlestick chart is in a strong bull trend, but it is climactic. The bulls need follow-through after last month’s strong rally. Yet, the absence of follow-through buying increases the risk of an exhaustion gap.
The monthly S&P500 Emini futures candlestick chart rallied strongly for 4 months. In addition, last month was an especially big bull trend bar. Furthermore, it reached several measured move targets based on the 2 year trading range. Finally, it is at the 2400 Big Round Number. Whenever a rally is especially strong and hits resistance, traders need to be aware that it could be a buy vacuum test of resistance. Hence, it could be an exhaustive end of the trend.
Buy climax at resistance
Since so many sites equate buy climaxes with trend reversals, many traders assume that they are the same. Yet, they are not. Most buy climaxes lead to trading ranges, not bear trends. The bulls are exhausted and take surprisingly big profits. After 10 bars or so, they decide if the bears did enough to reverse the trend.
Because the bears usually are unable to reverse a strong trend, the bulls see the reversal attempt as a bull flag and buy again. Yet, the bears are often able to temporarily stop a strong bull trend. In addition, if the bears can create good selling pressure in the pullback, they can create a credible major trend reversal. Hence, the bears will probably need many months before they can create a major reversal. Therefore, bulls will probably buy the 1st selloff.
Since this is a monthly chart, that 1st selloff could be 200 points, but still be small. While a pullback is likely soon, the odds are that the bears will need at least a micro double top before they can create a major reversal. Hence, a major top needs at least a couple more months.
Weekly S&P500 Emini futures candlestick chart:
Buy climax at resistance
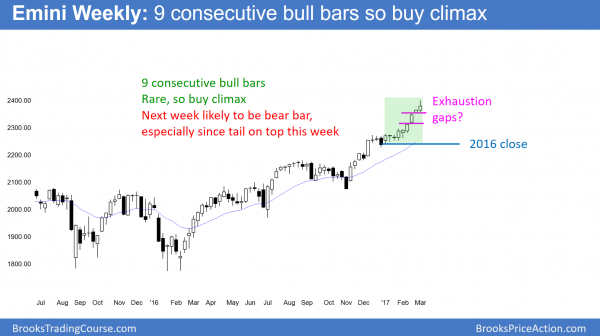
The weekly S&P500 Emini futures candlestick chart had its 9th consecutive bull trend bar this week. Since that is unusual, it is unsustainable and climactic.
The weekly S&P500 Emini futures candlestick chart had another bull trend bar this week. Yet, the bar had a big tail on top. Because 9 consecutive bull trend bars is very unusual, next week will probably be a bear trend bar. Hence, next Friday will probably close below Monday’s open. This is true even though March and April are, on average, the most bullish consecutive months of the year.
This week’s high was unusually far above the moving average. When the market is far above the average price, bulls stop buying. As a result, the market usually enters a trading range. Hence, the weekly chart will probably be sideways for the next month or two. The bottom of the range could be as low as last year’s close.
Can the market go much higher without first going sideways for at least a couple of weeks? I have been trading for 30 years. I rarely get to say, “I haven’t seen that before!” That is what I would say. It is not likely.
Daily S&P500 Emini futures candlestick chart:
Trump rally is exhaustive buy climax and parabolic wedge top
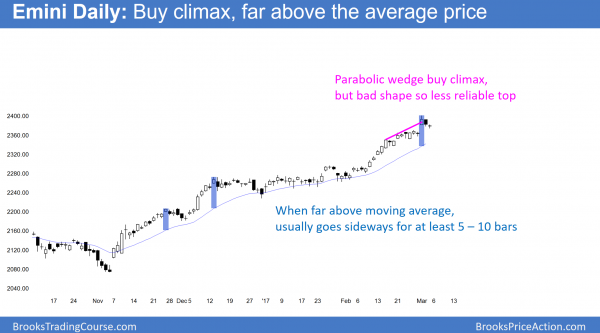
The daily S&P500 Emini futures candlestick chart had 3 pushes up in a tight channel over the past 3 weeks. Thursday’s reversal down made this a parabolic wedge top.
The daily S&P500 Emini futures candlestick chart has rallied strongly since the bull breakout in early February. Yet, it has had 3 pushes up, with the 1st push being the February 15 top of the breakout. While this is a parabolic wedge top, and Friday triggered the short, the bears need many more bars to reverse the trend. Furthermore, the shape of the wedge is not clear. Therefore many computers will not see it as a wedge top.
Failure to create an island top
The bears could have created a big gap down on Friday. They therefore could have created a dramatic 2 day island top. That would have increased the chances of a strong reversal down. If the bears were strong, they would have been able to do that. Therefore, the bears are not yet strong.
Yet, if they get a big gap down any day next week, it would create an island top. Hence, traders would again wonder if this was the start of the pullback to the December close.
Parabolic wedge top
When a parabolic wedge top reverses, it usually pulls back into a tight trading range for 10 or more bars. Furthermore, that range is usually sloped down somehwat. At that point, there is a 50% chance of trend resumption up and a 50% chance of a bear breakout. The bears usually need at least 2 big bear bars closing on their lows. Therefore, traders will watch for that if a tight trading range begins next week. If the bears get their 2 big bear bars, the odds are that the Emini will have a swing down on the daily chart.
Close of last year
The Emini never traded below last year’s close. Hence, it has been up all year. Because this is unusual, there is a 70% chance that the Emini will trade back below the December close at some point this year. Furthermore, there is a 60% chance that it will achieve the goal within the next couple of months.
Is this buy climax the top?
Bull trends are always reversing. But, my 80% rule says that 80% of reversal attempts fail. Therefore, as good as the current reversal is so far, it still will probably fail. However, Thursday’s big bear trend bar after Wednesday’s unusually big buy climax bar is important. This is especially true because the reversal was at the 2400 Big Round Number and several measured move targets. Hence, even of this week is not the final top before the 5% correction, the current rally will probably end within the next few weeks.
Reversal will probably be minor
Because the bull trend since November is in a tight channel, the 1st reversal down will probably be minor. Hence, bulls will probably buy it, even if it falls 5% to the 2016 close. Since the rally was so extreme, the bulls will probably wait for at least a 2 legged correction that lasts at least 10 bars before they will buy again.
If the bears get a deep correction, it will break below the tight bull channel that began in November. Hence, the bulls who bought at the high will be eager to exit on a rally back to where they bought. They will be disappointed by a deep pullback. They will therefore conclude that the Emini is no longer in a strong bull trend. Hence, they do not want to be long at the high.
Major and minor reversals
When bulls sell out of their longs on the test of the high, they might create a double top. Double tops are rarely perfect. However, a reversal down would be an attempt at a major trend reversal. This is unlike the upcoming 1st reversal down, which will probably be minor. A minor reversal leads to a bull flag or trading range. A major reversal leads to a bear trend.
It will probably take at least a couple of months for a selloff and then a test of the high. Therefore, any major reversal down is probably at least several months away. Hence, even though a 160 point selloff to the December close is a big move, it will probably not be the end of the bull trend.
Traders can see the end of the day bar-by-bar price action report by signing up for free at BrooksPriceAction.com. I talk about the detailed Emini price action real-time throughout the day in the BrooksPriceAction.com trading room. We offer a 2 day free trial.
When I mention time, it is USA Pacific Standard Time (the Emini day session opens at 6:30 am PST, and closes at 1:15 pm PST). You can read background information on the intraday market reports on the Intraday Market Update page.


Al,
Thank you for sharing your knowledge with us.
Al,
Question regarding trade management if trading the daily chart: If a trader has been holding a swing position since the BO in early November does it make sense to continue to hold this swing portion this late in the trend? At some point does the probability of a reversal become so strong that it is better to exit the scalp and swing portion of a trade (instead of simply trailing a stop below the Feb 2 low)?
In the course you talk about this, but it is aimed at day traders who need to exit EOD. Thanks!
Dave
My general approach is what many traders will be doing. When in doubt, they will take partial profits, and others buy puts. If enough take partial profits, the market can selloff surprisingly far and fast after a buy climax. Yet, even if I am right and it falls to the December close, most tops need some kind of double top or wedge. Since there is neither yet, the odds are that there would be at least a 50% rally after the 1st leg down.
I have talked about this in the chat room several times and used the monthly bond chart at an example. I believe that the nested wedge top will remain the high for the next 20 or more years. Yet, the odds are that it will rally over the next few months and possibly retrace 50% of this 1st leg down. That rally will probably form a lower high major trend reversal (all major trend reversal tops are variations of double tops), and therefore become the 1st lower high in the bear trend. It will allow swing trading bulls to exit with a smaller loss.
Al–this q is about the course. not sure this is the right place to post it, but…
I understand the concepts behind trending pa, channel pa etc. what would be helpful is to get insight into when, early in the channel for example, you conclude it is a channel. obviously seeing the whole day makes it easy. for me, it is reading the channel pa early that allows me to wait for appropriate entries at the TL/TCL. Perhaps the Pressure vid’s are the best place? so, what are the early signs pa has changed character?
thanks for any ideas on this.
The market is always in transition, and when a trading range is part of the transition, there is always uncertainty. All trading ranges contain both an early bull channel and an early bear channel.
Everyone wants clarity, but the probability only goes up after a strong breakout with follow-through. The math is still okay to enter early, but the winning percentage is only 40%. Hence, early swing traders are willing to lose most of the time. They do so because they are looking for swing trades, which means rewards that are more than double their risk.
Traders who want high probability have to wait for a strong breakout with follow-through. That creates clarity, which means high probability.
Al,
Are there any other factors outside of Trump, low interest rates and company growth making the S&P rise so dramatically ?
For several years, I have been saying that the monthly chart was probably forming a Final Bull Flag. Everyone knows that the target is about a measured move up. When a market gets near a target, it frequently accelerates. Why? The bulls become increasingly confident that the rally will reach the target and therefore have a high probability buy. The bears begin to believe the rally will hit the target, so why sell now when they can sell higher soon? The result is often an acceleration up to the target, creating a buy vacuum test of resistance. Then, everything changes. The bulls only want to buy a deep pullback and the bears suddenly are eager to sell. Hence, the market reverses.
There are always fundamental factors. The most important one is the Fed printing money, which is about to end. As will the Trump euphoria. The market is a international market. As Americans, we tend to think that only we matter. Wrong. There are all kinds of thing going on all over the world that are important, and they are contributing to this. None of it matters. The rally is technical. The reversal down to 1800 at the bottom of the Final Flag will also be technical. There is always news. Reporters feel they are the center of the universe.
Because news happens everyday, whenever the market rallies or sells of, TV reports it as news related. The news is the starting gun. The runners were already in place and they know where the finish line is. The gun only starts a process that was already planned long ago.
Markets are in constant search of the correct price at the moment, and it constantly changes because of countless variables. Therefore, the market is constantly probing too far up and too far down in search of a band of fair pricing. A buy climax is a probe that is too far up. The market will soon discover this.