Monthly S&P500 Emini futures candlestick chart:
Obamacare Health Care Act repeal starting 5% correction
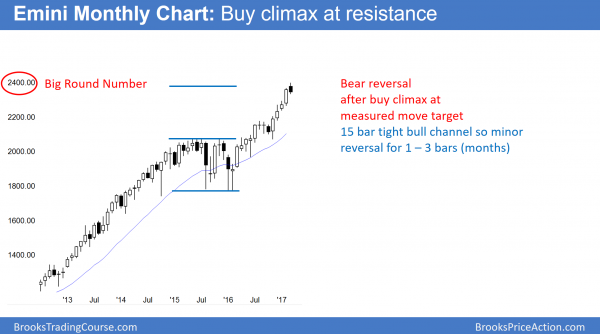
The monthly S&P500 Emini futures candlestick chart has a big bear bar so far this month. Yet, there is a week left. Hence, while unlikely, it could still end up with a bull body once it closes.
The monthly S&P500 Emini futures candlestick chart has a bear body so far this month. Since last month was a big bull bar, it was a buy climax. If this month closes on its low, it would therefore be a sell signal for a minor reversal down. Because this is the last week of the month, it determines what the bar will be once it closes. The bears will try to get it to close on its low. Yet, the bulls always want the opposite and they will try to buy at the end of the week. They therefore want to weaken the bear case for a 1 – 3 month pullback.
The bulls have 4 strong bull bars and a 15 bar tight bull channel. Therefore, the bears will probably need at least a micro double top before they can create a major reversal. Hence, even if this month closes on its low, there will probably be buyers not far below. Therefore, the bears will probably only get a 1 – 3 bar selloff.
Since bulls will buy that selloff, the reversal down would be minor and probably become a bull flag. Yet, a 1 – 3 month selloff on the monthly chart could easily fall 5% and 150 points. Therefore, the monthly bull flag would probably be a bear trend on the daily chart.
Only about 25% of minor reversals lead to opposite trends. Therefore the odds favor buyers below.
Weekly S&P500 Emini futures candlestick chart:
Failed breakout above wedge bull channel
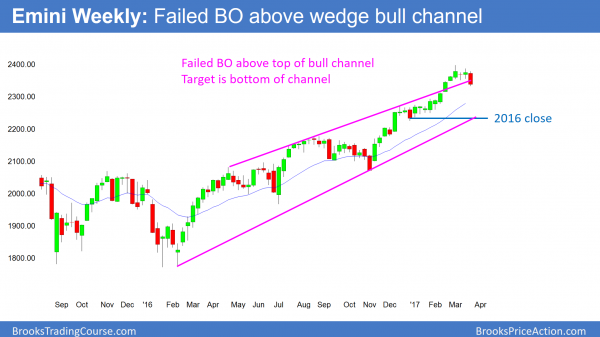
The weekly S&P500 Emini futures candlestick chart has a micro double top after a buy climax at the monthly measured move target. Furthermore, this week is a failed breakout above a bull channel. The target is therefore the bottom of the channel, which is around the close of last year.
The weekly S&P500 Emini futures candlestick chart’s high from 4 week’s ago was exceptionally far above the moving average. When that happens, the odds are that the Emini will work down to the moving average. The moving average is just above the close of last year. Since there is a 70% chance that the Emini will test that close this year, a pullback to the moving average will probably fall to last year’s close. Hence, TV will report that the stock market gave back all of 2017’s gains.
Yet, the bull channel over the past 5 months is tight. Therefore the reversal will probably create a Big Up, Big Down, Big Confusion pattern. Since confusion is a hallmark of a trading range, the selloff will probably be a bear leg in a trading range. Because trading ranges have legs up and down, bulls will buy the selloff. They would therefore correctly be betting that a trading range would be more likely than a bear trend. Furthermore, they would swing trade part of their position, hoping that the bull trend was resuming.
Failed breakout above bull channel
The Emini has been in a wedge bull channel on the weekly chart for more than a year. The February rally broke above the bull channel. Yet, 75% of the time, a bull breakout above a bull channel fails within 5 bars. Furthermore, the reversal down usually reaches the bottom of the channel. Since that bottom would be around the December close, this reversal is another reason for a swing down to the December close.
Daily S&P500 Emini futures candlestick chart:
Strong bear breakout needs follow-through selling
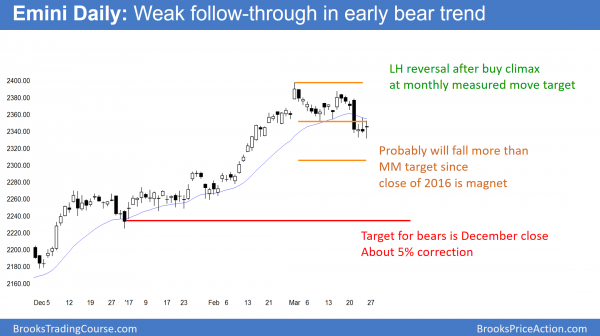
The daily S&P500 Emini futures candlestick chart had a big bear trend bar on Tuesday. Yet, the bears need more bear bars to confirm the breakout and convince traders that the 5% correction has begun.
The daily S&P500 Emini futures candlestick chart reversed down strongly on Tuesday. Tuesday closed below the lows of the 20 bars. Furthermore, it did so after a lower high reversal. In addition, the reversal followed an extreme buy climax that tested a measured move target up from a 2 year trading range.
I have said that there has been a 60% chance of a test of last year’s close within the next 2 months. Since this was an unusually big bear bar, the odds are that this is the start of the selloff.
Start of bear trend?
When there is a strong reversal down in a new bear trend, there is often an immediate pullback. In about 20% of cases, the pullback goes up to and even above the top of the bear breakout bar. As long as the bulls do not strongly break above last week’s lower high, the bears are in control. Hence, the odds favor a swing down for a month or two. The minimum target is the December – January trading range. That trading range is therefore a likely Final Bull Flag.
A test of that range is also a test of the 2016 close. While the selloff would be a bear trend on the daily chart, it would be a minor reversal and a bull flag on the monthly chart. Therefore, traders will look to buy around last year’s close.
Obamacare Health Care Act weekend politics
The Stock market is deciding if the 5% correction has begun. The bulls are reluctant to give up and they therefore are still willing to buy. Hence, politics over the weekend could lead to a big gap on Monday.
If the gap is up, the Emini could rally up to last Tuesday’s sell climax high. Yet, unless the bulls break above the lower high, the odds still favor that the 5% correction began last week.
If there is a big gap down and if Monday then sells off more, traders will conclude that the move down to the December close has begun.
If the market believes Trump is losing the political battle, it will begin to doubt his ability to create tax reform. Tax reform is bullish and priced into the market. If traders suspect that it will fail, the market will then reprice down.
Traders can see the end of the day bar-by-bar price action report by signing up for free at BrooksPriceAction.com. I talk about the detailed Emini price action real-time throughout the day in the BrooksPriceAction.com trading room. We offer a 2 day free trial.
When I mention time, it is USA Pacific Standard Time (the Emini day session opens at 6:30 am PST, and closes at 1:15 pm PST). You can read background information on the intraday market reports on the Intraday Market Update page.


