Market Overview: Nifty 50 Futures
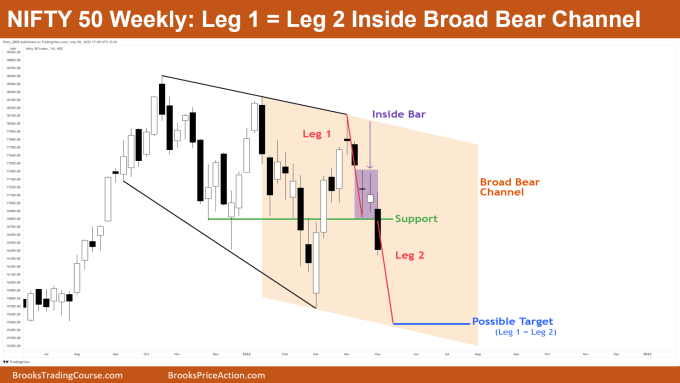
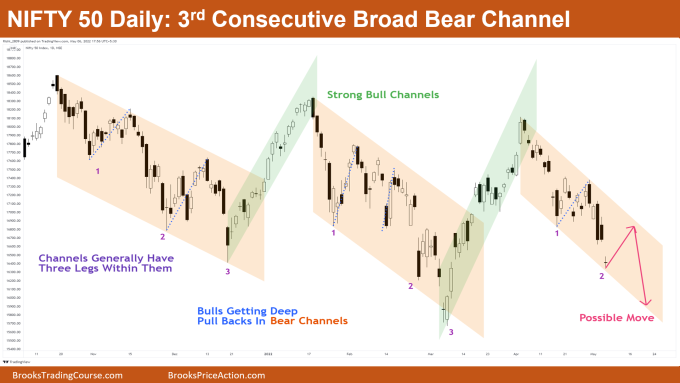
The Nifty 50 futures successfully had breakout of last week’s inside candle and support with a possible Leg 1 = Leg 2 inside broad bear channel on the weekly chart. A big bear bar closing near its low continued the broad bear channel. On the daily chart, the Nifty 50 is forming consecutive broad bear channels.
Nifty 50 futures
The Weekly Nifty 50 chart

- General Discussion
- Market still in the expanding triangle and a possible broad bear channel
- Market continuously giving deep pullbacks on either side
- Whenever market gives deep pullbacks, this generally means that the market is either in a broad channel or in a trading range.
- In our case the market is probably in a broad bear channel
- Deeper into the price action
- Market moving in two legs down (possible measured move down)
- This is where the concept of Leg 1 = Leg 2 comes in, where a leg simply means a move or a swing in a particular direction up or down
- Whenever market is in a channel or trading range and shows us a two legs move, we can project the possible target for the 2nd leg, as shown in the chart image above.
- Patterns
- Market has given a breakdown of the inside bar with a big bear bar closing near its low.
- As market was in a trading range many bulls had placed their buy limit orders at support (shown in green) but now they are trapped.
- Those bulls could now possibly scale in to their positions on High 1 or High 2 opportunities to get out at breakeven on first trade and with profit on other.
- This would just result in a stairs pattern, which is nothing but a sign of a broad channel and weak move down.
- Pro Tip
- In general, you should never buy at the high of the trading range and never sell at the low.
- This generally becomes tempting but most of the time it’s just a trap and a false breakout, so avoid buying high and selling low
- As we are assuming this weekly chart to be in a broad trading range, we do not buy until market reaches much lower near the Trading range low (as market “Possible Target”)
The Daily Nifty 50 chart

- General Discussion
- Nifty 50 is showing consecutive broad bear channels on the daily chart.
- Overall, the market is just flat for the last 100 bars on the daily chart.
- Market looks like a trading range therefore you trade it like a trading range. Buy at the lows and sell at the highs, as that is best strategy for this market.
- Deeper into price action
- This is the 3rd consecutive broad bear channel with 2nd leg in the last channel already completed.
- You can clearly see that bulls are causing deep pullbacks to the upside when market moves down (shown in purple color).
- Whenever this happens, the market is in a broad bear channel, which generally means that a breakout of channel would lead to a broad trading range.
- That is what happened here as you can see after the breakout of the 1st and 2nd broad bear channels. The market converted into a broad trading range.
- Patterns
- On daily chart the market is in a trading range. Look to buy low and sell high.
- With this 3rd broad bear channel down, possibilities are that market would be spending 2-3 weeks sideways once reaching the Leg 1 = Leg 2 measured move.
- Nifty 50 could be going back up to the bear channel high and then resuming the 3rd push down to end the 3rd and possible last broad bear channel on the daily chart.
Market analysis reports archive
You can access all weekend reports on the Market Analysis page.

