Market Overview: Nifty 50 Futures
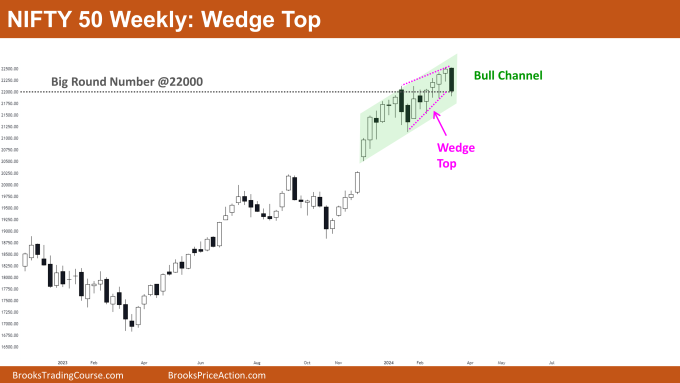
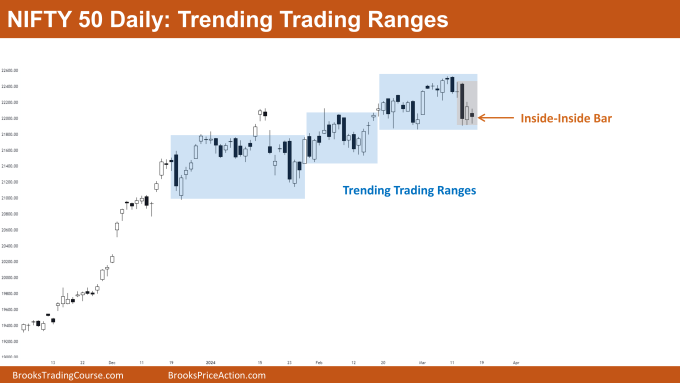
Nifty 50 Wedge Top on the weekly chart. This week, the market showcased a significant bearish momentum, reflected by a strong bear bar. However, it remains within the confines of a bullish channel, diminishing the likelihood of an immediate reversal. Despite the bearish breakout from the wedge top, bears require a substantial follow-through bar to confirm the breakout. Nifty 50 hovers near the pivotal 22000 mark, suggesting potential trading range behaviors across weekly and smaller time frames. On the daily chart, Nifty 50 demonstrates a trending trading ranges pattern, characterized by inside-inside bar formations.
Nifty 50 futures
The Weekly Nifty 50 chart

- General Discussion
- The market persists within a robust bull channel amidst a prevailing bullish trend, implying that a single bear bar is insufficient to prompt a reversal.
- Bears are advised to exercise caution before selling, awaiting confirmation through a convincing bear follow-through.
- Long-positioned bulls should refrain from exiting trades unless confronted with consecutive strong bear bars.
- A subsequent strong bear bar in Nifty 50 could signify an opportunity for bears to initiate selling for a potential double top major trend reversal.
- Traders should note that reversals carry lower success probabilities, emphasizing the importance of maintaining a minimum 1:3 risk-to-reward ratio.
- Deeper into Price Action
- Despite recent developments, bears have struggled to produce two consecutive strong bear bars. Another bear bar could elevate the likelihood of a trading range scenario.
- Observations over the past ten bars reveal increased tail formations and diminished candle body sizes, indicating a potential impending trading range.
- Patterns
- The bearish breakout from the wedge top typically presents thrice the likelihood of success compared to a bullish breakout.
- Should the market generate a follow-through bar, adherence to the classic market cycle would gain credibility.
The Daily Nifty 50 chart

- General Discussion
- The market currently operates within trading ranges, allowing both bulls and bears to capitalize by buying near lows and selling near highs.
- With Nifty 50 nearing the significant 22000 mark, traders should anticipate sustained trading range behaviors on the daily chart.
- Deeper into Price Action
- Trending trading ranges resemble broad bull channels, offering profit opportunities for both buyers and sellers.
- A bearish breakout from the trading range could result in an extensive trading range, aligning with market cycle theory predictions.
- Patterns
- Presently, the market exhibits an inside-inside bar pattern, commonly observed during the trading range phase.
- Should bears achieve a breakout from the trading range, a measured move down equivalent to the range’s height could be expected, with converse implications for bulls.
Market analysis reports archive
You can access all weekend reports on the Market Analysis page.

