Market Overview: Nifty 50 Futures
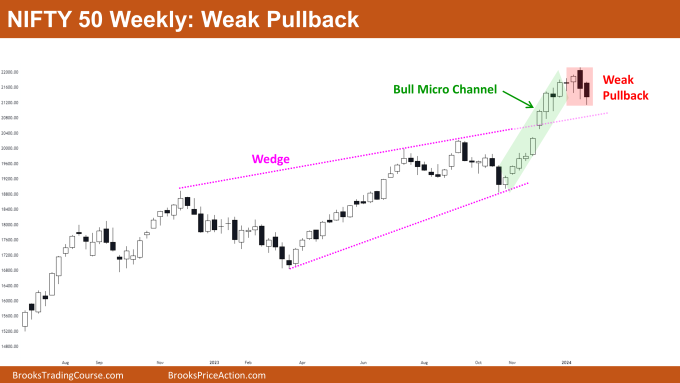
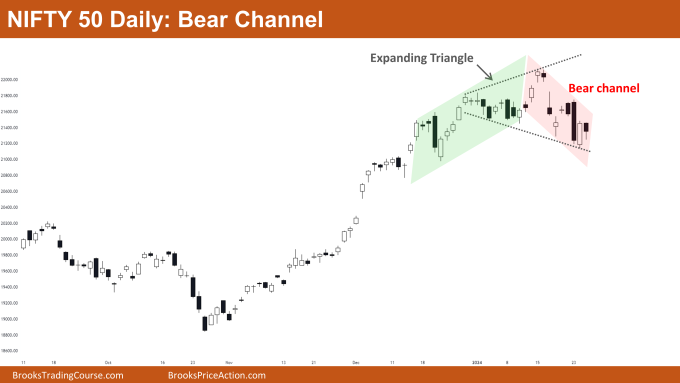
Nifty 50 Weak Pullback on the weekly chart. This week, the market once again formed a weak bear bar with a tail at the bottom. However, these bear bars lack the strength to reverse the robust bull trend. Notably, this marks the first pullback on the weekly chart following the bull breakout of the wedge pattern. On the daily chart, Nifty 50 is currently within a small bear channel, having experienced a bear breakout of the bull channel, transforming the market into a trading range.
Nifty 50 futures
The Weekly Nifty 50 chart

- General Discussion
- Bulls not in a long position seeking a buying opportunity should be prepared for a possible high-1 soon.
- Bulls already in a long position are advised to hold their positions until the market exhibits a strong reversal attempt.
- Bears should refrain from selling as the market continues to trade in a strong bull trend, with no strong bear bars observed after the wedge bull breakout.
- Deeper into the Price Action
- Before the onset of the pullback, the market was in a bull micro channel, indicating higher chances of at least a 2nd leg up before a potential reversal.
- It is noteworthy that bears are now able to form consecutive bear bars with decent body size after a prolonged period. This increases the likelihood of a reversal following the 2nd leg up.
- Patterns
- The market successfully executed a bull breakout of the wedge pattern.
- Generally, the odds of a successful bull breakout of a wedge top are around 25%.
- If bears can turn this bull breakout into a failed bull breakout, the market may transform into a significant trading range.
The Daily Nifty 50 chart

- General Discussion
- Nifty 50 is displaying trading range price action on the daily chart. Therefore, the most prudent strategy for both bulls and bears is to buy low and sell high.
- Given the current proximity to the possible trading range bottom, bears are advised to avoid selling at this point.
- Deeper into Price Action
- Recently, the market has started forming numerous gaps on both sides (up and down), creating confusion among traders and contributing to increased trading range price action.
- Additionally, the market is exhibiting more bad follow-through bars, where bull bars are followed by bear bars and vice versa.
- Patterns
- Nifty 50 is currently trading inside a bear channel and is close to the bottom of the expanding triangle pattern.
- The market is aligning with the market cycle, transitioning into a trading range after giving a bear breakout of the bull channel.
Market analysis reports archive
You can access all weekend reports on the Market Analysis page.

