Market Overview: Nifty 50 Futures
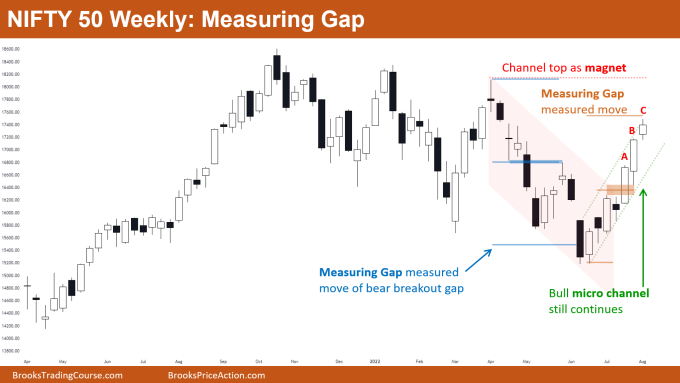
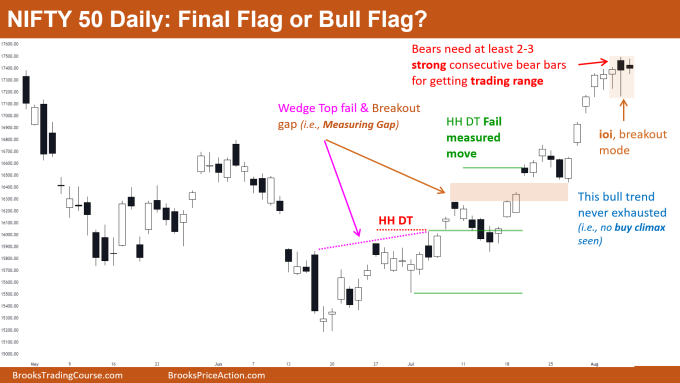
Nifty 50 measuring gap on the weekly chart formed another bull bar (this time a small one) and continued the bull micro channel after breaking above the bear channel (red). Currently, Nifty has achieved measuring gap and measured move target, so one can expect some profit taking at this level, but 60% chance that the market would show 2nd leg up before reversing down. Nifty 50 on daily chart forming inside-outside-inside (ioi) bar which can act as a bull flag or as a final flag (more on this later).
Nifty 50 futures
The Weekly Nifty 50 chart

- General Discussion
- Nifty 50 near measuring gap target so bulls can exit some part of their position, but as the move is strong, bulls expect at least 60% chance of 2nd leg up.
- Market in bull micro channel so generally more buyers below bars than sellers. When the market is in a bull micro channel, this phase is also known as the breakout phase.
- Once the market starts trading below prior bars (in a breakout phase) then there are higher chances that the market would convert into a tight bull channel, rather than an immediate reversal down (more on this in pro tips)
- Deeper into the price action
- The market had formed 2 consecutive bull bars closing near their high (bar A & B) so this was the start of the Buy The Close trend.
- The market had a breakout above the bear channel (red colored), therefore bulls would be expecting the market to reach the top of the channel.
- Aggressive bears would be shorting the high of bar C, assuming bulls would book some profits as reaching the measuring gap and measured move target.
- Patterns
- Market creating breakout gaps on either side (notice the one marked with blue) which creates confusion. This is the hallmark of a trading range.
- Traders would be now looking to buy low sell high and scalp, as this is just a trading range. The market very often forms always in long patterns near trading range top, and always in short patterns near trading range bottom.
- Pro Tip [below explanation based on daily chart]
- Patterns like an inside-outside-inside bar, inside-inside bar, and outside-outside bar are breakout mode patterns that can work as final flags or as flags depending upon bars to the left. But in general, there are 50-50 chances of a successful breakout to either side.
- Let’s take an example. Consider the inside-inside bar forming late in trend after buy climax, and now the market is near a strong resistance. So rather than 50-50 chances, there is a greater probability of this inside-inside bar being a final flag rather than a bull flag.
The Daily Nifty 50 chart

- General Discussion
- The market on the daily chart is going upside strongly and also leaving breakout gaps open – a sign of the strength of the bulls
- From the most recent bars, the market has never seen a significant pullback, so this is just a tight bull channel. Traders should be only looking to buy until bears get strong consecutive bear bars
- Deeper into price action
- From most recent bars Nifty 50 never formed strong and big consecutive bear bars, therefore traders should always look to buy.
- Aggressive bears would be selling the low of the latest bar with a wide stop, assuming this inside-outside-inside bar is the final flag.
- If the market starts to pull back to the downside, then bulls would be still looking to buy on a High 1 and High 2 as they know there are 60% chances of 2nd leg up. (Therefore even a 1:1 risk to reward would result in positive traders’ equation).
- Patterns
- Every Wedge Top is a Higher High Double Top (HH DT).
- Always remember that if the wedge top fails and the market starts resuming up then the minimum bulls want is a measured move up based upon DT height (shown in green color).
- Whenever you see wedge top fail and a bull breakout gap, then chances are very high of this leading to a bull trend. So always look for these types of price action
Market analysis reports archive
You can access all weekend reports on the Market Analysis page.


Great Stuff. Thanks
Thanks Karam