Market Overview: Nifty 50 Futures
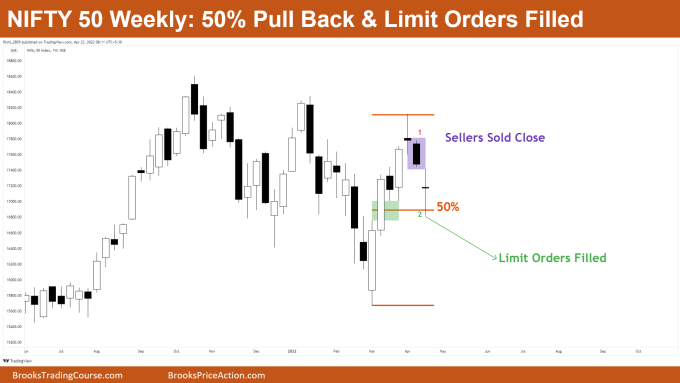
The Nifty 50 futures pullback (50%) gave a indecisive close (i.e., Doji) for this week, and filled the buy limit orders present at the positive gap. Overall week was sideways with no major move. Nifty 50 gapped down on the open (i.e. Monday ~start of the week) and the close was pretty disappointing for the bears. Now let’s deep dive into some great details of price action of the week
Nifty 50 futures
The Weekly Nifty 50 chart

- General Discussion
- On Monday (1st day of the week) market gapped down, as sellers sold the close of bar 1.
- Sellers who sold the close quickly booked their profits at the area of confluence
- Here confluence was the 50% pullback and the positive gap (which certainly has pending buy limit orders…)
- Deeper into the price action
- So why am I saying that positive gap has pending buy limit orders?
- What this means: Consider if you were a seller and you sold the high of a bull bar but then the market never came back to your breakeven point
- That is what forms a gap, and then as a seller what you do is place a buy order at breakeven and wait
- And that is why that positive gap acts like support
- Patterns
- Market still in the expanding triangle
- Market slowly converting into trading range
- Buyers bought at limit order on 50% pullback, but finally disappointed by the doji bar
- Pro Tip
- Whenever you find area of confluence you place limit order to buy for scalp
- Like here you saw positive gap as support and 50% pull back
The Daily Nifty 50 chart

- General Discussion
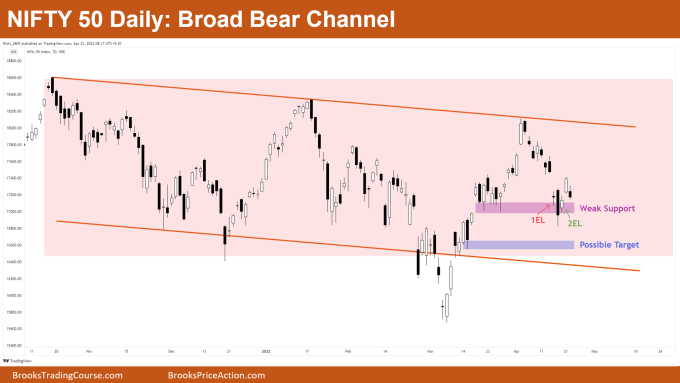
- If you zoom out your daily chart, the market has just converted into a Spike and Channel Pattern (bull trend and then bear channel)
- Buyers bought at the 2nd Entry Long Bar near the Support area
- Market currently in Broad Bear Channel and also in a Middle of the Trading Range (most uncertain area of the trading range where you should avoid establishing positions in the market)
- Deeper into price action
- As the market was falling, many traders bought the 1st Entry Long on the small Doji bar, but buyers were disappointed by the Big Bear bar
- Buyers got second chance to enter on 2nd Entry Long Bar
- Again buyers could only drive the market upside for 1 bar and then market started reversing down again
- If market breaks the Support area then this could be the Possible Target (i.e. near Range Bottom)
- Patterns
- Always remember Broad Bear Channels often act like a Trading Range
- So always look to trade them as Trading Range
- Failed 2nd Entry Long spotted on the chart which could be the possible sell setup for the week ahead
Market analysis reports archive
You can access all weekend reports on the Market Analysis page.

