Market Overview: Nifty 50 Futures
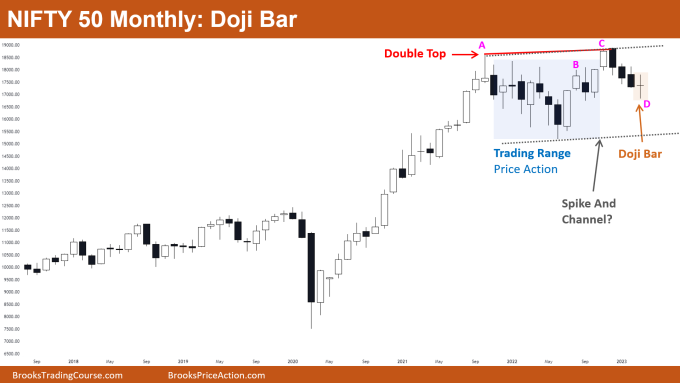
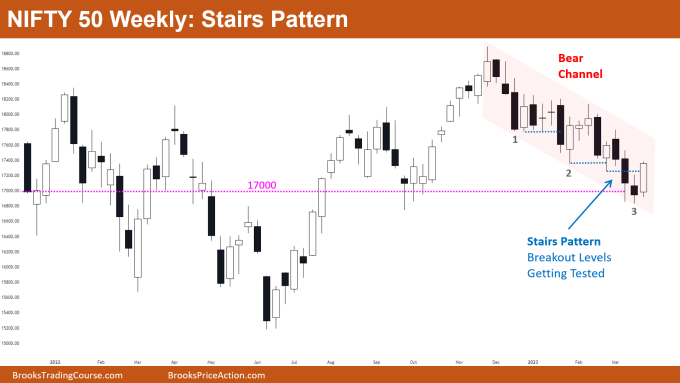
Nifty 50 doji bar on monthly chart. After three consecutive bear bars, the market created a doji bar this month. The monthly chart is in a bull trend, the market may be trading in a bull channel. The price action over the past 20 bars on the monthly chart shows us a trading range. Market is currently trading close to the big round number (Rs. 17000), which is providing support for the price, and is following the stairs pattern inside the bear channel on the daily chart.
Nifty 50 futures
The Monthly Nifty 50 chart

- General Discussion
- Due to the three consecutive bear bars and the fact that the market is currently trading close to the top of a potential bull channel, some bears would sell for a Low 2 short.
- Bulls would stay away from buying the High 1 above the doji bar since there is a greater risk of a second leg down than an 2nd leg up, and purchasing above a bear bar further decreases the likelihood of a successful trade.
- Price is barely over the 17000 level, thus market may go sideways for a while before beginning another 2nd leg down.
- Deeper into the price action
- In general, there is a higher likelihood that the market will form a second leg up in the same direction after a strong leg up. On the chart, a few examples are displayed:
- Leg C was the second leg up after Leg A, which was a very strong bull leg.
- Leg B was a strong bull leg, followed by a second leg up (Leg C).
- Since the bull trend completed, the market hasn’t formed a significant bear bar, so the likelihood of a reversal is very slim.
- In general, there is a higher likelihood that the market will form a second leg up in the same direction after a strong leg up. On the chart, a few examples are displayed:
- Patterns
- Whenever market forms a spike in one direction then odds of continuing in that direction in a channel are higher, this is called the spike and channel pattern.
- The channel after the spike may occasionally be flat, occasionally broad, and occasionally tight like a trading range (like in the above image).
The Weekly Nifty 50 chart

- General Discussion
- Because the market is trading within the bear channel, bears can short for swing positions and bulls can scalp for marginal gains.
- The 17000 price level is serving as a market support, which increased bullish buying at the close of bar 3.
- Bulls would soon book their profits on their long positions, and bears would begin selling once the market reached the channel’s peak (i.e. the upper trend line of the channel) as the market is currently trading in the middle of the bear channel.
- Deeper into price action
- Take note that the bear breakouts of swing lows 1, 2, and 3 did not produce any breakout gaps. The market retested the swing lows 1, 2, and 3 after breaking below them. Why does that matter?
- As a result, limit order bulls are purchasing at swing lows and profiting! When more bulls are compelled to buy at swing lows as a result, the market may eventually break out of the bear channel.
- Patterns
- Given that this is the third bear leg of the bear channel, some traders may view this as the bottom of a wedge.
- A wedge bottom at a strong support always tempts bulls to buy in anticipation of a breakout, just as the big round number 17000 serves as support above the market.
Market analysis reports archive
You can access all weekend reports on the Market Analysis page.

