Market Overview: Nifty 50 Futures
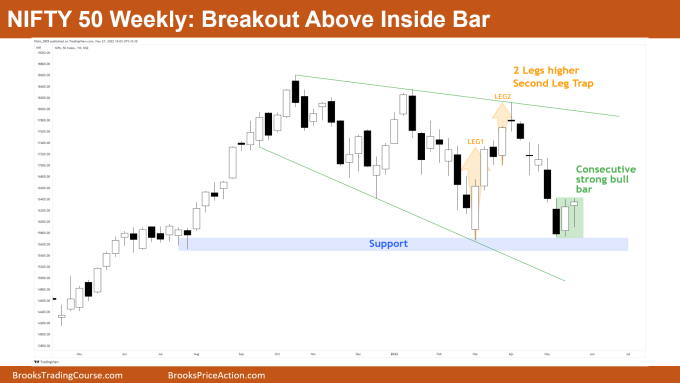
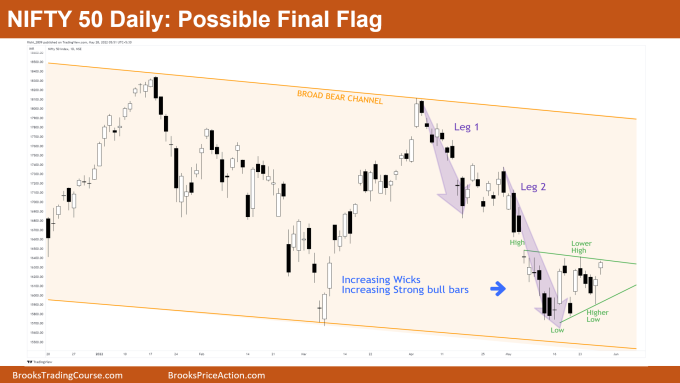
The Nifty 50 futures on the weekly chart is currently trading near major support, has formed an inside bar, and with potential breakout above inside bar. The market could move 2 legs upside from here. On daily chart, the NIFTY 50 is still in a broad bear channel and has completed 2 legs down, now forming possible final flag.
Nifty 50 futures
The Weekly Nifty 50 chart

- General Discussion
- Market gave 2 consecutive bull bars near the support area, also the 2nd bull bar was a breakout of the inside bar.
- The breakout of the inside bar would be start of the 1st leg up, and the minimum market could give is 2 legs sideways to up.
- As market likes to move in 2 legs up (as it did on previous leg), this means you can buy above on a High 1 if the 1st leg is strong enough.
- Deeper into price action
- You can see the last time the market came to this support area, it bounced up abruptly.
- But this time market formed small bull bars, and also the 2nd bull bar has a tail.
- With increasing tails, it points to market can go into Trading Range.
- But in this case, there are higher chances that the market can reverse down after 2nd leg up (especially if 2nd leg up is weak) so you can expect one more test down to support.
- Patterns
- Whenever you get an inside bar which is a bull bar, then buying on the breakout of that inside bar has a higher probability than buying above bear inside bar.
- Pro Tip
- Market generally likes to move in 2 legs especially after any kind of breakout or breakdown, and then it decides whether to continue in the direction of breakout or to reverse.
- Example: Suppose market results in breakout of a triangle, then the minimum market would give us is 2 legs up and a decision on whether to continue up or reverse down.
- If you see strong reversal signs after the 2nd leg up (of triangle breakout) then this would mean that market could reverse and trap the buyers (who bought the triangle breakout).
The Daily Nifty 50 chart

- General Discussion
- Market is in a broad bear channel for a long time now. Looking left on the charts we can see market showing climatic moves up and down suggesting a trading range.
- Market forming triangle near the bottom of the broad bear channel, and this could be final flag.
- Increasing trading range price action is seen in the triangle, with so many tails and bad follow-through bars.
- Deeper into the price action
- Whenever you see the following characteristics like
- Increasing tails
- Increasing bad follow-through bars
- This means that there is high probability that market would be converting at least into a trading range soon, or market is likely to reverse its direction.
- In general, when market is showing increase in Trading Range price action, with patterns like wedge / channel, this would suggest that there is a loss of momentum in the trend with now a higher probability of reversals.
- Whenever you see the following characteristics like
- Patterns
- Market in broad bear channel and completed 2 legs down and the 2 legs were climatic.
- After 2 legs market forming triangle near the bottom of the broad bear channel.
- This means that there is high probability that this is a final flag rather than bear flag.
- Always remember the minimum you need for a triangle is 5 legs in the pattern and lines would not be perfect.
- Or you can also think it in this way → the minimum you need for triangle is 1) A High, 2) Lower High, 3) A Low, and 4) Higher Low i.e., you need 4 swings to satisfy the pattern as triangle.
Market analysis reports archive
You can access all weekend reports on the Market Analysis page.


Excellent Analysis !
I am new to trading and I must say your analysis helps me a lot to understand the concepts discussed by Mr. Brooks in the course along with making some money to support my family. Thoroughly appreciate your work Rishi.
Thank you very much for that appreciation Tanmay