Market Overview: NASDAQ 100 Emini Futures
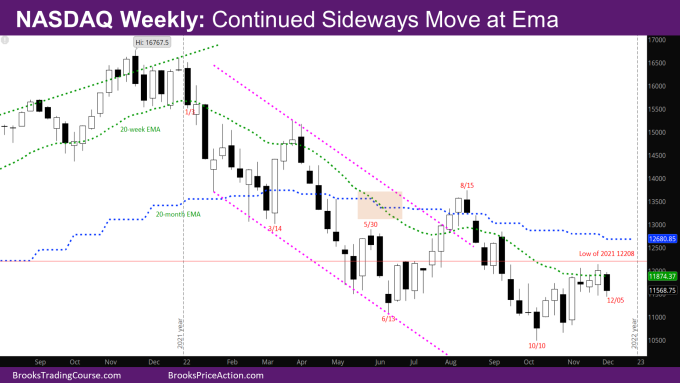
The NASDAQ Emini futures market in a continued sideways move at the weekly exponential moving average (EMA).
Last week was an outside bull bar. The market went below the low of last week and closed above it. Given the big bars with overlap over the last couple of weeks, and that we are in an expanding triangle, it’s more likely next week will be another sideways bar (possibly like the week of 7/4).
NASDAQ 100 Emini futures
The Weekly NASDAQ chart

- This week’s candlestick is a big bear bar at the weekly EMA with a small tail at the bottom.
- Since the last two weeks are big overlapping bars, it’s more likely there are buyers below last week.
- If next week is an outside up bull bar, it could signify higher prices – two outside up bars in a couple of weeks would represent two attempts by bears to sell and fail.
- If next week is a big bear bar, it could signify lower prices till around the bottom of the week of 11/7 (the big bull bar to the left).
- What would have been better for the bears is to create a sell signal bar near the top of last week.
- The bears still see the market having made a wedge bear flag – three pushes up from the October low.
- The question is – Is the continued sideways move of the past three weeks part of the 2nd push up, or the 3rd push up?
- The market is in a trading range – What we don’t know is where is the top of the range – somewhere between the weekly and monthly EMA.
- The longer the sideways move goes though without closes above EMA, the more the chances are better for bears for a move down.
- One problem for the bulls still is that the signal bar from the week of 10/10 is a bear bar like back in June.
- This is still likely a minor reversal from the October low and bulls will need a good entry bar in the next month or two around the bar from the week of 10/10.
- As mentioned before, the low of last year at 12208 will be a magnet for the rest of the year. The bulls want to close the year above the low of last year, while the bears want a close far below the low.
- Given how strong a bull bar last year was, it’s more likely this year will close around 12208 or above than far below it.
The Daily NASDAQ chart

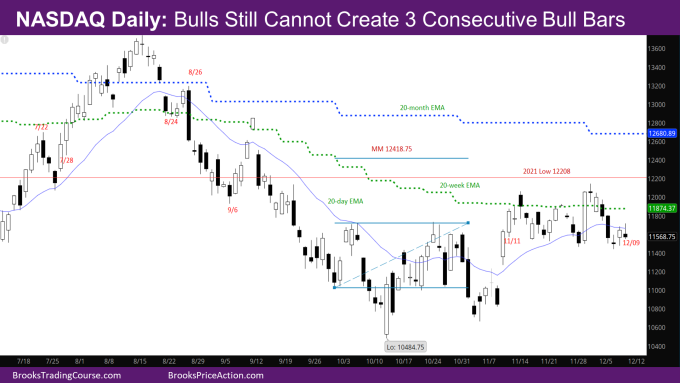
- Friday’s NQ candlestick is a Low 1 sell signal bear bar near the bottom of a trading range that has been going on for the past 3 weeks.
- Monday and Tuesday were strong bear bars that reversed most of the bull bar from 11/30.
- This is a sign that the market is in a trading range.
- The comment from two weeks back still holds – While the bulls have created pairs of good bull bars, and even single big bars, they have not been able to create three consecutive bull trend bars with good closes.
- In the continued sideways move of the last two weeks, the bears are stronger in that they have been creating a 3-bar bear micro channel (bars where the high does not go above the prior high).
- For that same reason, the market may have to go more sideways/down and create more consecutive bull bars before a credible breakout above the weekly EMA.
Market analysis reports archive
You can access all weekend reports on the Market Analysis page.

