Market Overview: NASDAQ 100 Emini Futures
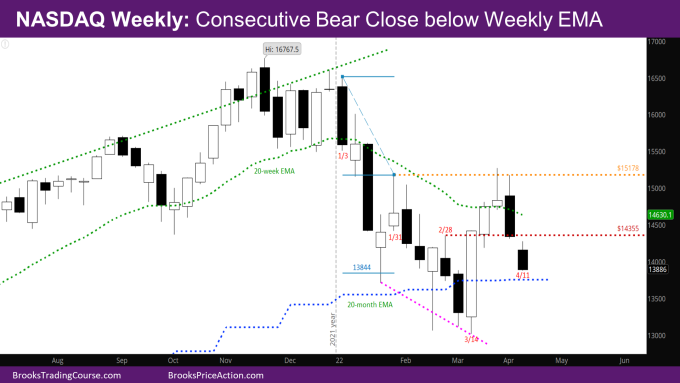
Nasdaq consecutive bear close on its low and below weekly EMA. It is a good follow-through bar to last week’s big bear bar.
The week gapped down and had strong selling pressure – 3 of the 4 trading days in the week had good bear bodies. The bulls had a good reversal attempt on Wednesday, but Thursday reversed all of Wednesday and closed on its low.
The market is again approaching the monthly EMA – there is enough momentum down such that it should again go below the monthly EMA.
Its also possible that the April month will be an inside bar, which would setup an ioi (inside-outside-inside) on the monthly chart.
NASDAQ 100 Emini futures
The Weekly NASDAQ chart

- This week’s NASDAQ candlestick was a consecutive bear bar closing on it’s low. This is now the 2nd week with a close below the weekly EMA.
- This week was expected to go below last week, and the buyers have not yet come in. Last week’s report mentioned that there should be buyers at at 13997.75 – the 50% pullback of bodies of the breakout bar 3/14 and follow-through bar 3/21. There was some buying around this level on Wednesday, but no follow-through on Thursday. In fact, Thursday completely reversed Wednesday’s action.
- At this point, it is very likely the market will go below the monthly EMA.
- The bulls do not want 3 consecutive bear bars, so it’s also likely that next week will be a bull bar or at least a doji bar. It could go below the monthly EMA, and then reverse.
- The bears would like next week to close well below the monthly EMA. If next week is also a bear bar, it would be the first time since May 2021 that there are 3 consecutive bear bars.
- Unless the bears can have consecutive strong bear bars closing below the monthly EMA, it is still reasonable that the lower end of the range will be around the monthly EMA.
The Daily NASDAQ chart

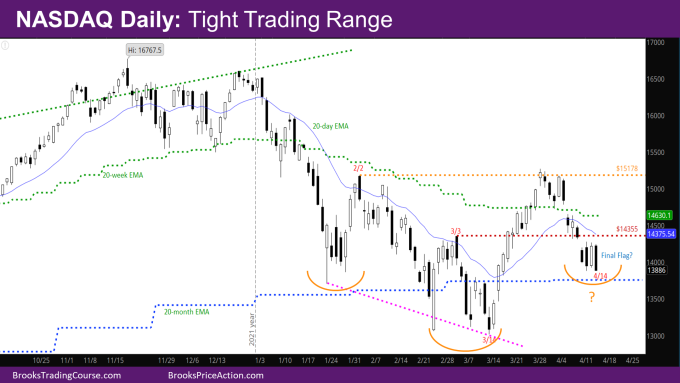
- Friday’s candlestick on the daily NASDAQ chart was a bear bar closing near its low. While the days in the week had strong bodies, and the bars were big, the week was also a tight trading range sideways. This could be a final flag in this move down.
- Monday gapped below the 3/3 high, thus closing the case of what could have been a breakout test pullback for the breakout in March.
- The bulls made two attempts to reverse – Tuesday gapped up, but then sold off. Wednesday was a bull day, but Thursday sold off again. When the market makes two attempts at a direction and fails, it usually tries the other direction.
- The first 3 days of the week also formed an iOi and Thursday was trying to break below the iOi.
- The daily chart is pulling back from the tight bull micro-channel/spike that started in the middle of March. The pullback is in its third leg, but the second leg last week was tight.
- All the reasons above make it more likely that there will be some more down next week before sideways to up.
- There should be a 2nd leg up for the spike in March after the pullback ends. At this point, the pullback has been deep so the 2nd leg up will likely be smaller.
- The market may also try to make the right shoulder of an inverse H&S with neckline at 15178.
Market analysis reports archive
You can access all weekend reports on the Market Analysis page.

