Market Overview: NASDAQ 100 Emini Futures
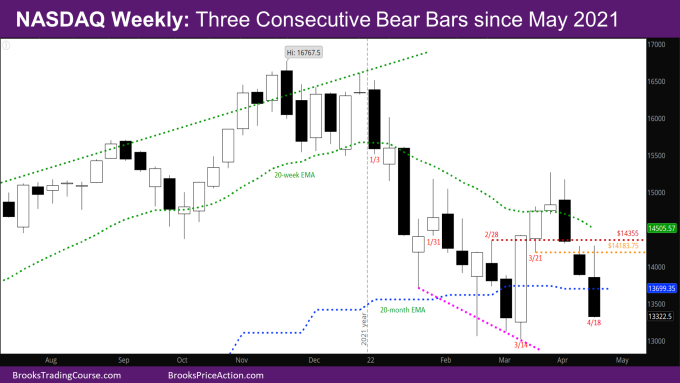
The NASDAQ Emini futures weekly candlestick is a big outside bear bar closing on its low well below the monthly EMA (good for the bears). This is the first time since May 2021 that there are three consecutive bear bars.
The week opened below last week’s low, then went above last week’s high before relentlessly selling off for the last two days of the week.
We are at an interesting point now – we are low enough in the trading range, that there should be buyers soon. At the same time, the bears are strong – they have almost completely reversed the bull leg in March. The three weekly bear bars are reasonably equal sized relative to each other such that there isn’t exhaustion (unlike the disparately sized bars in the bull leg of the trading range).
Bears selling here are confident they can sell more at the monthly EMA above, or at the high of this week and make money. Based on this, this bear leg down is stronger than the bull leg up in March. It is more likely that the market will go below the March low before going much above this week’s high.
At this point, the monthly bar is a big bear bar. The goal for the bulls next week is to close above the monthly EMA around 13700. If the bears close below the monthly EMA, it will be the first time since December 2018.
NASDAQ 100 Emini futures
The Weekly NASDAQ chart

- This week’s NASDAQ candlestick is a big outside bear bar closing on its low well below the monthly EMA.
- This week was expected to go below last week, and below the monthly EMA. The open questions were:
- Would the week close above the monthly EMA?
- Would it to be a doji bar with tails at the bottom?
- Would the bulls be able to avoid a 3rd consecutive bear bar?
- The answer to all the above was an emphatic “No”.
- At the same time, the tail at the top of the bar confirms trading range price action – the bulls who bought the low of the week of 3/21 and bought more lower (close of last week) made money.
- Given the above, bulls will buy the low of March, confident that if it breaks below it, they can buy lower and still make money.
- The bears want another strong bear bar, which would be a follow-through bar for the breakout below the monthly EMA.
- It now looks like the 1st leg down did not finish in January. Instead it’s possible the 1st leg was the March low, and we are now forming the 2nd leg, which is another reason why the market will likely go below the March low.
The Daily NASDAQ chart

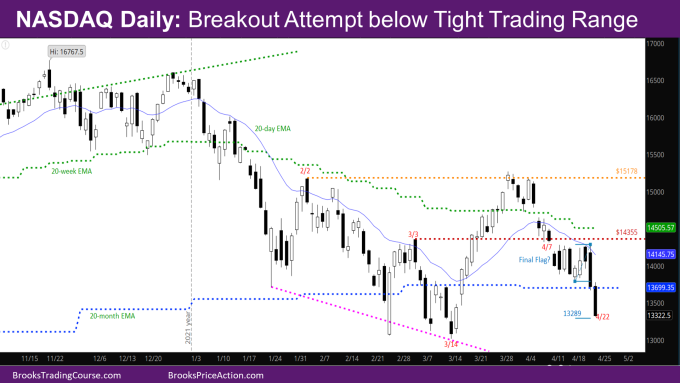
- Friday’s candlestick on the daily NASDAQ chart was a big consecutive bear bar closing at its low. Last week was a tight trading range (TTR), and the first 3 days of this week continued that, before the last 2 big days which broke out below that range.
- It has been harder for Limit Order bulls to make money buying the prior lows on this bear leg – the bulls who bought the low of 4/1 or 4/7 have not made money. That may have contributed to the selloff in the last 2 days – those bulls finally gave up when the market couldn’t go above the TTR.
- The market is almost at the measured move (MM) target of the range of the TTR.
- The bear leg does not look like a wedge – rather than this being the 3rd leg, it looks more like the 2nd leg. Given the two big bear days this week, there should be another leg down.
- The market is almost at the bottom of the spike from mid-March. There should be buyers at the bottom of that spike, confident that even if the market goes below it, they should make money.
- The pullback from the spike in March has been deep that its not clear how big the 2nd leg of the spike will be.
- The case for the market making the right shoulder of an inverse head & Shoulders (shown in last week’s report) with neckline at 15178 has broken down.
Market analysis reports archive
You can access all weekend reports on the Market Analysis page.

