Market Overview: NASDAQ 100 Emini Futures
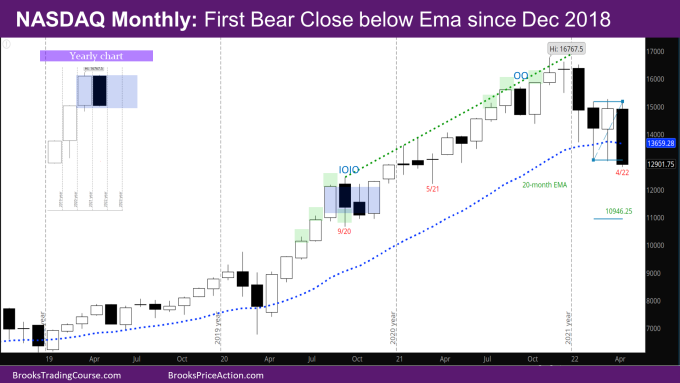
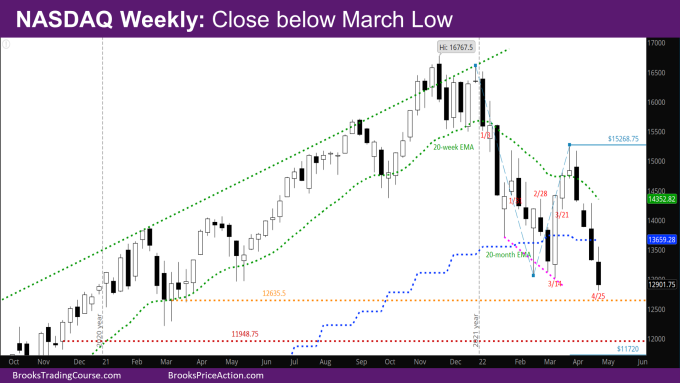
This week’s Nasdaq Emini candlestick is a big bear bar closing near its low below the prior low of the year – the week of 3/14 -and below Exponential Moving Average (EMA). The first monthly bear close below EMA since December 2018 – the first time in more than ten years with two consecutive weekly bear bars below the monthly EMA.
The week opened below last week’s low, and every rally attempt was sold.
As was mentioned last week, this bear leg down is stronger than the bull leg up in March. Now that the market has gone below the March low, there will likely be a 2nd leg down, to some of the targets shown in Weekly chart below.
The monthly bar is a big bear bar closing below the monthly EMA for the first time since December 2018. Next month will likely be a bull or a doji bar to disappoint the bears. If next month is a bear bar closing well below April close, it is possible the market might make a MM of inverse Double Bottom with target at 10946.25 as shown in Monthly Chart.
NASDAQ 100 Emini futures
The Monthly NASDAQ chart

- The candlestick on the monthly NASDAQ chart is big bear bar with a close below the March low.
- At this point, the bears are stronger than the bulls – the market did not even go above the March high, and the month closed on its low whereas previous months have closed with tails at the bottom. Three of the last 4 bars have bear bodies, so likely the market will go sideways to lower in the next couple of months.
- If the market goes lower, it would be trying to break below a micro double bottom and a wedge – which has more likelihood of failing within a few bars.
- If the breakout is successful, the target would be around 10950. This would be around the November 2020 open when the market broke higher from the ioi (inside-outside-inside) of August, September, October.
- More likely, next month will be a doji bar to disappoint the bears. One reason is that there have not been two consecutive bear closes below the EMA going back to at least 2010.
- The market maybe in the process of forming a bigger trading range as evidenced by the two-month pullback in September, October 2021 and now a five-month pullback since December.
- In terms of what is possible for the rest of the year, and the next year, see the inset yearly chart. One possibility is inside/sideways bars for this and next year like the monthly chart in August-October 2020, setting up a breakout mode on yearly chart.
The Weekly NASDAQ chart

- This week’s NASDAQ candlestick is a big bear bar closing near its low. It is a good follow-through bar to the breakout bar last week below the monthly EMA. It also closed below the prior low of the week of 3/14.
- This week was the fourth consecutive bear trend bar below the weekly EMA. This is the first time in a long time when this is happening. Prior cases of four bear bars have been where some were above the EMA, or where some were dojis. This shows that bears are strong.
- All the above says there will likely be a second leg down, even if there are one or two pause weeks in the next couple of weeks. Next week will likely be a doji or bull bar, as bulls will buy the low of March.
- Some of the lower targets shown on the Weekly Chart are –
- March 2021 open at 12635.5
- November 2020 open at 11948.75
- Leg 1 Leg 2 move at 11720
Market analysis reports archive
You can access all weekend reports on the Market Analysis page.


Hi Rajesh,
Very good analysis! Could you indicate in the future probabilities for Bear or Bull scenario?
In the short-term (weekly chart), bears are stronger – so likelihood of going down to somewhere between the 1st and 2nd targets mentioned in the Weekly analysis is 60%. On the longer-term chart (monthly), bull trend has been strong for past 1.5 years, so the likelihood of the MM breakout below is 20-40%. If May is another bear bar closing well below monthly EMA, the probability for bears increases to maybe 40-50%.
Awesome analysis on Daily and Monthly NASDAQ chart.