Market Overview: NASDAQ 100 Emini Futures
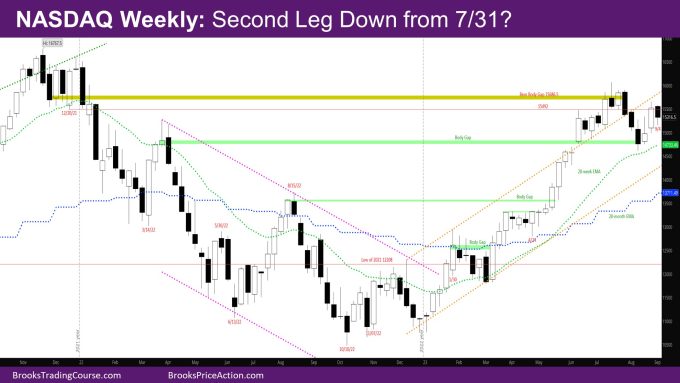
The NASDAQ Emini futures week is a bear inside bar with a tail below. It is possibly the start of the second leg down from 7/31, when the first leg down started.
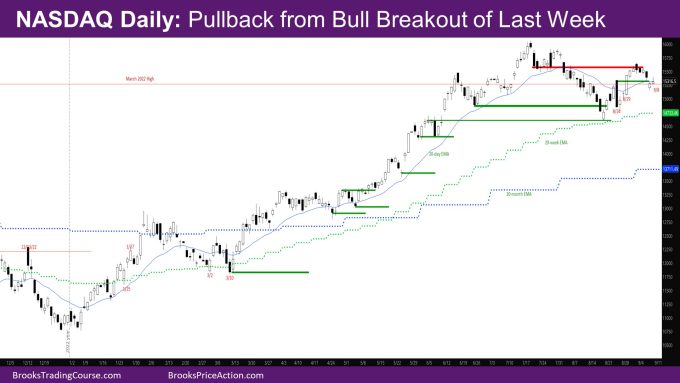
On the daily chart, this week looks like a pullback from the breakout of last week.
This week was a short trading week, as Monday was a trading holiday.
NASDAQ 100 Emini futures
The Weekly NASDAQ chart

- The week is a bear inside bar with a tail below.
- Last week’s report had mentioned that this week was likely to be a bear bar or a bar with tail below.
- This is because the market was back in the region where limit order bulls were trapped from buying the low of the week of 7/24.
- At the same time bears who sold the high of the bear bar of week of 8/14 got out breakeven. That may explain the tail below this week.
- So, the question is – Is next week another bear bar. It is likely that next week will also be a bear bar or have a tail below.
- Buyers will likely only come in below the low of last week – 8/28 which was a strong bull bar.
- There is also the outstanding test of the exponential moving average (EMA)
- Bears wanted to close the body gap with March 2022, which they did couple of weeks ago, although with only a small overlap.
- If bulls can go up from here, the body gap close would be a considered a negative gap – a small overlap, but trend resumption up.
The Daily NASDAQ chart

- Friday is a bull bar with a long tail above and closing slightly above the EMA.
- Last week, the market mostly had strong bull days. It was a breakout above the big bear day of 8/24.
- This week is a pullback from the breakout testing the breakout point and below.
- As part of breaking out, the high of last week reached the area of trading range on the chart from which the strong bear leg down started at the beginning of August.
- What was support before, now became resistance (shown on the chart as the red line above the bars of this week)
- Tuesday was a bull bar with tails.
- Wednesday was a big bear bar with a tail below, bouncing off the daily EMA.
- Thursday gapped down into the top of the trading range from 2 weeks ago, from which last week had broken out. The day ended as a bull reversal bar just below the ema with a small tail above.
- Friday would have been a good entry bar if it had closed on its high. Instead, Friday closed with a long tail above, but closing slightly above the high of Thursday – which is the minimum thing the bulls needed to do.
- While this leg down looks like a leg in trading range – no strong consecutive bear bars, Wednesday fell far below Tuesday and Thursday gapped far below Wednesday making another leg down likely.
- 8/29 was a strong bull bar. There should be buyers below that bar if the market gets there.
Market analysis reports archive
You can access all weekend reports on the Market Analysis page.

