Market Overview: NASDAQ 100 Emini Futures
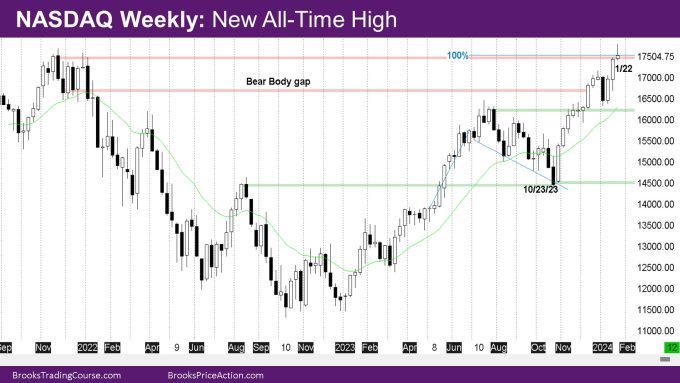
The NASDAQ Emini futures week is a doji bar with a long tail above and a small bull body closing near its open. The market had a new all-time high since Nov 2021 but closed slightly below the Nov 2021 weekly high close. The disappointing bar could represent a failed breakout above the 2021 high.
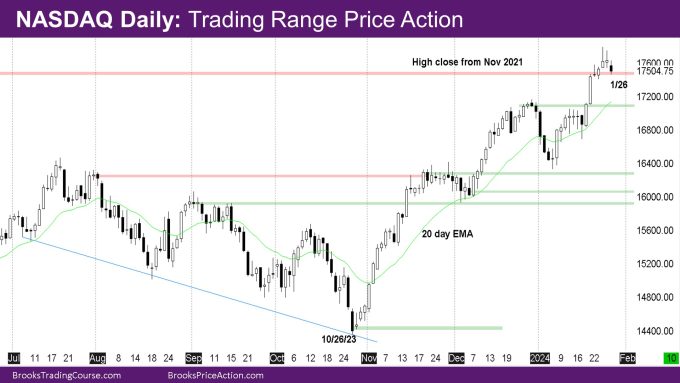
On the daily chart, the market entered the channel phase after the spike phase on Thursday and Friday last week. The price action though was more trading range price action with tails on every bar.
The monthly bar is still a bull bar with a close above December high, but a prominent tail above and a long tail below. There are 3 more days left. Bulls would like to close the month as a bull bar ideally with a close above the December high and near its high so there is a minimal tail above. Bears would like to close the month as a bear bar, even if it’s a bad sell signal bar (with the long tail below). Minimally, they want the close below the 2021 monthly high close of 17251.5
NASDAQ 100 Emini futures
The Weekly NASDAQ chart

- The week is a bull doji bar with a long tail above.
- Bulls at a minimum needed a bull bar and they got it.
- The market also went above the 2021 all-time high and had a close just below the 2021 high close.
- The market also made the Measured Move (MM) target of the bodies of the May and June 2023 monthly bars which was around the 2021 high.
- The market is at important targets, so profit-taking is expected.
- By this week being a bull bar, the market has created a bull micro-channel whereby there are 3 bull bars whose lows are higher than the prior bar low.
- This means that there are buyers below because the market will likely come back to this week’s close even if there is a deep pullback.
- At the same time, this week is a disappointment bar and will likely result in a pullback next week for 1 or 2 weeks.
The Daily NASDAQ chart

- Friday is a small bear bar with small tails.
- This week was the channel phase of the spike from last week that started when Tuesday pulled below Monday low and reversed as a H1 bull bar.
- Wednesday was a big bull bar at one point but ended the day with a close below the mid-point.
- Thursday was a doji bull bar and Friday was a small bear bar closing near the open of the week.
- The trading next 3 days could be volatile as it will determine the shape of the month.
- Bulls could look at Wednesday as a bad sell signal bar and buy around the current price such that the market closes above Wednesday when the month closes producing a good monthly bull trend bar.
- Bears instead want follow-through bear bars on Monday and Tuesday so they can close the month with as bad a bull bar as possible.
- It is likely the market will revisit the strong leg down in January at some time in the future, when the current move up transitions into the bear leg of a trading range.
Market analysis reports archive
You can access all weekend reports on the Market Analysis page.

